Quote Plus PDF
1. Overview of Screen
HERO FSS is characterized by strong focus on the user interface, which allows for convenient switching between screens and quick and easy viewing of relevant data.
'[3000] Quote Plus’ screen is one of screens that best reflect such characteristic. Beyond simple price view, this screen shows various data that can affect prices of a given stock such as current price and chart of the stock, daily price trend and investor trend. In addition, the user can quickly place ‘buy / sell / change / cancel’ order or move to other related screens using link button and right mouse button.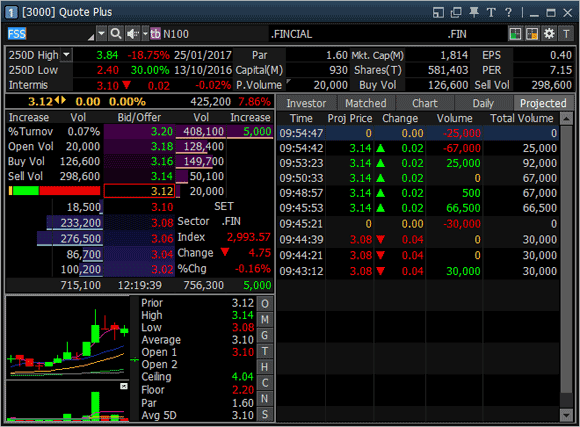
'[3000] Quote Plus’ screen is one of screens that best reflect such characteristic. Beyond simple price view, this screen shows various data that can affect prices of a given stock such as current price and chart of the stock, daily price trend and investor trend. In addition, the user can quickly place ‘buy / sell / change / cancel’ order or move to other related screens using link button and right mouse button.

2. Description of Screen
Selection of a stock to be viewed. Enter or select a stock to be viewed.


Selection of a stock to be viewed
The user can directly enter a stock to be viewed.
Click  button to open a list of stocks previously viewed.


Click  next to stock name to see ‘Info’ and ‘Memo’ for the selected stock.
Memo function allows the user to write down opinions and thoughts about a stock. This memo can be checked at any time from other screens. This is a simple user database for stocks in addition to the price viewing of the screen.
Example a stock has memo
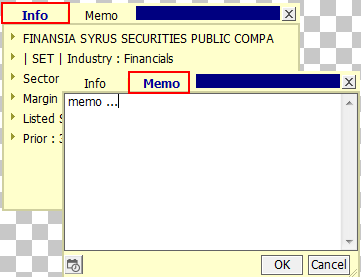
Memo function allows the user to write down opinions and thoughts about a stock. This memo can be checked at any time from other screens. This is a simple user database for stocks in addition to the price viewing of the screen.
Example a stock has memo

Selection of a stock to be viewed through search
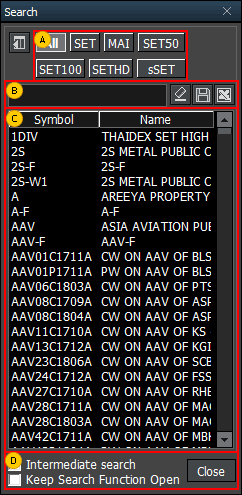
Click button to open the ‘Search’ pop-up window and select a stock to be viewed.
Click

Select a category to be viewed.
Directly enter a stock to be searched and viewed.
Click to save the search result as a TXT file on the user’s PC.
Click to save the search result as an Excel file on the user’s PC.
Click
Click
A list of stocks in the category selected in  or a list of stocks based on the search results described in
  is provided.
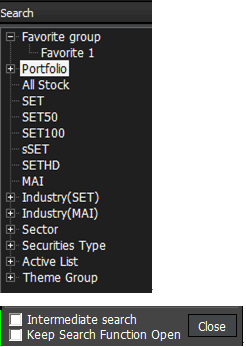
User will be selected stocks from menu on left side the screen.
-Favorite Group
-Portfolio
-All Stock
-SET
-SET50
-SET100
-sSET
-MAI
-Industry (SET)
-Industry (MAI)
-Sector
-Securities Type
-Active List
-Theme Group
 or a list of stocks based on the search results described in
  is provided.
User will be selected stocks from menu
-Favorite Group
-Portfolio
-All Stock
-SET
-SET50
-SET100
-sSET
-MAI
-Industry (SET)
-Industry (MAI)
-Sector
-Securities Type
-Active List
-Theme Group

Intermediate Search and Keep Search Function Open functions can be selected.
-Intermediate Search: When searched a stock by alphabet (A-Z), a stock will be shown although where an alphabet is in that position.
-Keep Search Function: When double clicked at stock, popup stocks search will be always show.
-Intermediate Search: When searched a stock by alphabet (A-Z), a stock will be shown although where an alphabet is in that position.
-Keep Search Function: When double clicked at stock, popup stocks search will be always show.
Signal mode / rotator mode functions
HERO FSS helps the user view stock price information by providing signal mode / rotator mode functions.
Click to set signal mode and rotator mode.
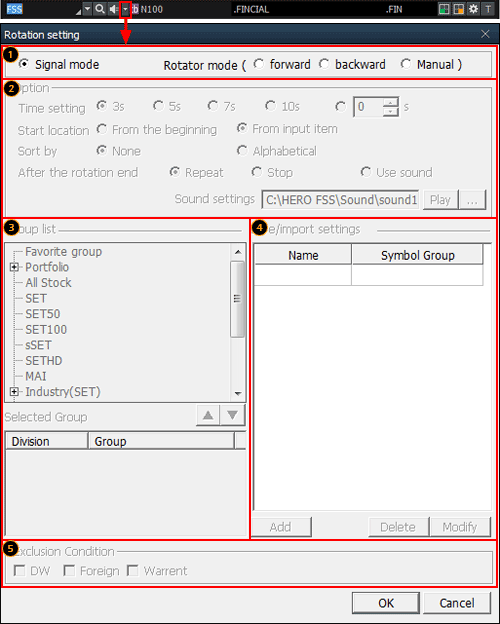
HERO FSS helps the user view stock price information by providing signal mode / rotator mode functions.
Click

Mode selection
Signal mode
This mode is a general mode that views price information of a stock selected by the user.
This mode is a general mode that views price information of a stock selected by the user.
Rotator mode
This is a mode that views price information of multiple socks according to the conditions set by the user (stock, direction, time, etc.).
This is a mode that views price information of multiple socks according to the conditions set by the user (stock, direction, time, etc.).
Forward: Price information of the selected stocks is rotated in forward direction of the list.
Backward: Price information of the selected stocks is rotated in backward direction of the list.
Manual: The user can manually click to decide rotating direction to view the selected stocks.
Stock rotator option
Time setting: Time of automatic rotation of stocks can be set.
Start location: A stock can be designated as the starting location on the list of stocks.
Sort by: Sorting order of the stock list can be set.
After the rotation end: Operation to be done after the end of rotation of the selected stocks can be set.
Sound setting: A wav file on the user’s PC can be selected
Designation of rotator stock list
Double click a group from the group list for rotator view or click button to show the selected group in the selected group area at the bottom.
One group or multiple groups can be selected.
Click button to delete the selected group.
Double click a group from the group list for rotator view or click
One group or multiple groups can be selected.
Click
After selecting the stock group for rotator view in  , click
  button to save the selected group.
 , click
 Exclusion condition can be set for the stocks selected for rotator view.
Change additional information
Click button at the top right corner of the screen to change additional information provided at the bottom. Details will be shown as picture below:
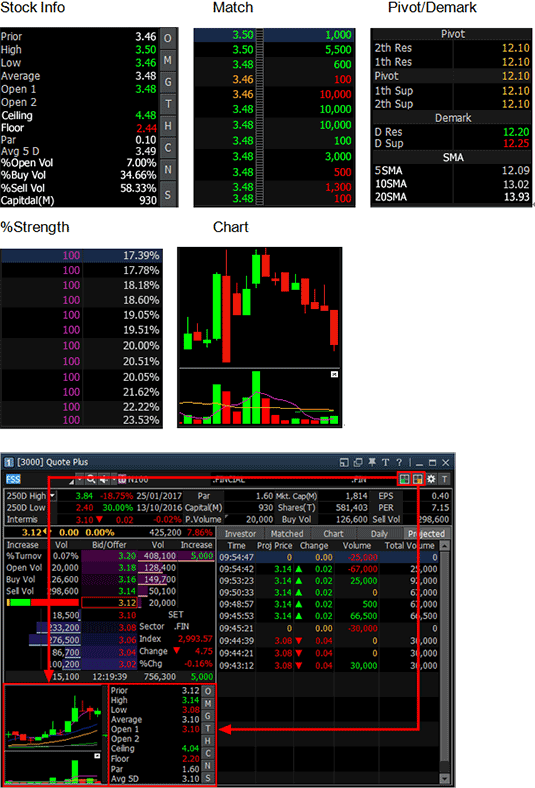
Click

Settings
Current price screens of HERO FSS can quickly recognize prices of stocks through various graphics and colors.
To fully utilize such functions, click button at the top of the screen and select desired options.
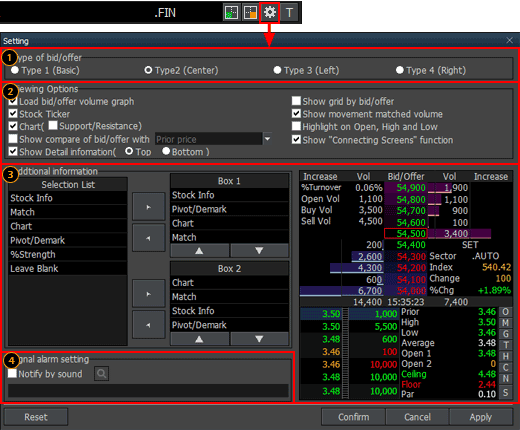
Current price screens of HERO FSS can quickly recognize prices of stocks through various graphics and colors.
To fully utilize such functions, click

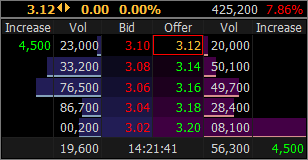
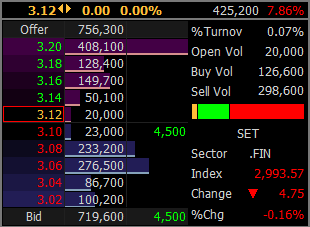
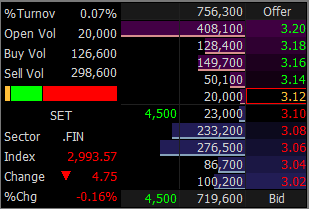
Type of bid/offer setting
One of 4 types including ‘Basic, Center, Left and Right’ can be selected according to position of bid/offer data.
Basic Type divides bid and offer into left and right sides and arranges prices vertically. This type can clearly distinguish between bid status and offer status.
Center Type divides bid and offer into left and right sides around the center, allowing for easy analysis of bid and offer information.
Left Type and Right Type align bid/offer information in a line on the left side or right side.
Finansia HERO offers different types of bid/offer alignment and additionally provides a graph that shows remaining volume of each bid/offer price. User convenience was maximized to intuitively recognize bid/offer information by providing different bid/offer arrangement types and graph for remaining volume of each bid/offer price.
Type 1 (Basic)
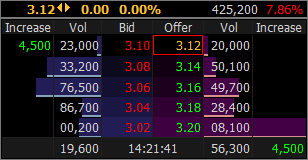

Type 2 (Center)

Type 3 (Left)

Type 4 (Right)

Viewing options
Load bid/offer volume graph: Bid/offer volume is displayed as a graph.
Show gird by bid/offer: Bid/offer grid display can be set.
Stock ticker: Stock ticker display can be set. When selected  button will be shown screen 1000 (Stock ticker)
Show movement matched volume: Instantaneous match volume equalizer display of (hourly) match tab can be set.
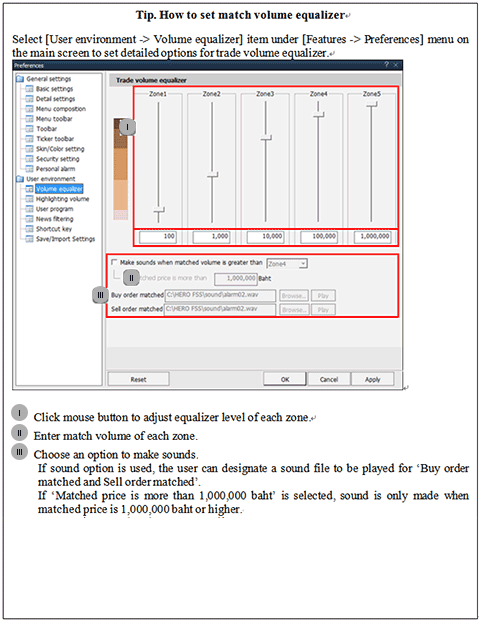

Chart: Chart display and support/resistance display on the chart can be set.
Highlight on open, high and low: Display of highlight on daily open, high and low prices can be set.
Show compare of bid/offer with ‘prior price’: Percent change can be viewed with prior price/open/high/low condition.
Show connecting screens function: Display of connecting screen button in the bid/offer area can be set. Selection O,M,G,T,H,C,N,S buttons to be also linked that screen.
Show detail information: Location of detailed stock information such as ‘250D High, 250D Low, PreOpen2, and P/E’ provided at the top of the screen can be selected.
Additional information
Additional information provided when  button is clicked at the top right corner of the screen can be set. Up to 4 items can be set each for the top and the bottom. Order of items can be changed using
  buttons or mouse drag & drop.
Signal alarm setting: Signal alarm setting can be set by selecting a sound to be used.
Bid/offer area order function
On the bid/offer window of the current price screen, put the mouse cursor on a bid/offer and click the right mouse button to open an order menu for ‘Buy, Sell, Change/Cancel’.
Select an order item to automatically enter the selected price into ‘[4000] Mini Order’ screen, which allows for fast order placement with minimal time and route.
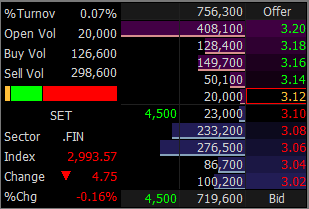
Select an order item to automatically enter the selected price into ‘[4000] Mini Order’ screen, which allows for fast order placement with minimal time and route.

Additional / special functions on right mouse button
Finansia HERO has maximized user convenience by providing various additional and special functions when the right mouse button is clicked on the screen
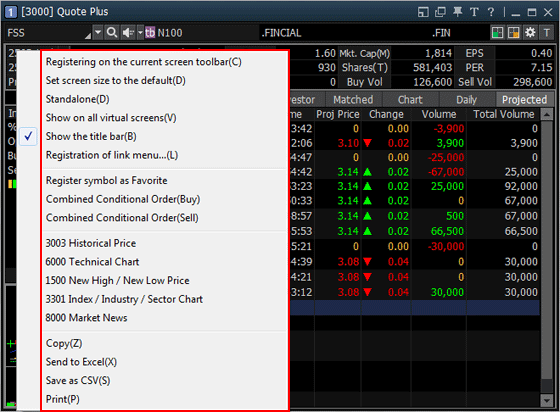
Finansia HERO has maximized user convenience by providing various additional and special functions when the right mouse button is clicked on the screen

Registering on the current screen toolbar(C)
Select this option to register the current screen on the main screen toolbar.
Select this option to register the current screen on the main screen toolbar.
Standalone(D)
Select this option to recognize the current screen as a standalone window and freely move it out of the Finansia HERO frame.
Select this option to recognize the current screen as a standalone window and freely move it out of the Finansia HERO frame.
Show on all virtual screen(V)
Select this option to show the current screen on all virtual screens in use.
Select this option to show the current screen on all virtual screens in use.
Show the title bar(B)
The title bar at the top of the screen can be shown or hidden.
The title bar at the top of the screen can be shown or hidden.
Send to Excel(X)
Data on the current screen can be sent to the Excel program. Data generated using 'Send to Excel' function is not saved. Data must be saved before closing the Excel program.
Data on the current screen can be sent to the Excel program. Data generated using 'Send to Excel' function is not saved. Data must be saved before closing the Excel program.
Save as CSV(S)
Data viewed are saved as a CSV file of Excel. Click this menu, enter saving location and name, and click ‘Save’ button to save data.
Data viewed are saved as a CSV file of Excel. Click this menu, enter saving location and name, and click ‘Save’ button to save data.
Description of Screen
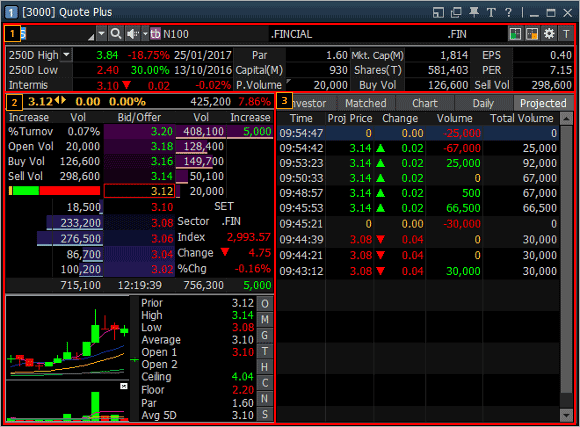
Detail information
Select a stock to view detailed information about the stock such as 250-day high/low, par, capital (M), P. volume, EPS, and PER.
Click to select an item among 250-day high/low and year high/low.
Especially, this screen provides rotator view function, group price view, and memo function. The memo function adds a simple user database for each stock.
Select a stock to view detailed information about the stock such as 250-day high/low, par, capital (M), P. volume, EPS, and PER.
Click
Especially, this screen provides rotator view function, group price view, and memo function. The memo function adds a simple user database for each stock.
Bid and offer window
Bid/offer and additional information of the stock can be viewed such as Last price, Change ,%Change Total volume of Buy/Sell orders , %Previous
Finansia HERO displays remaining bid/offer order volume as a bar graph so that remaining volume of each bid/offer price can be determined intuitively.
Additional information can be changed by clicking button at the top right corner of the screen. Click
  button to decide detailed settings on the ‘setting’ screen
Bid/offer and additional information of the stock can be viewed such as Last price, Change ,%Change Total volume of Buy/Sell orders , %Previous
Finansia HERO displays remaining bid/offer order volume as a bar graph so that remaining volume of each bid/offer price can be determined intuitively.
Additional information can be changed by clicking
Connecting screens function
Investor/Matched/Chart/Daily/Projected
Use the tabs at the top to view ‘Investor, Matched, Chart, Daily, Projected’ information of the stock. Match equalizer function provided under Matched tab is a function that displays recently matched volume using an equalizer, which allows the user to intuitively understand momentary buy/sell strength.
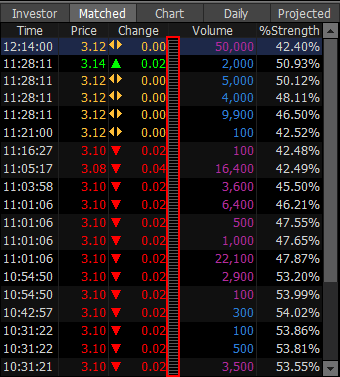
Use the tabs at the top to view ‘Investor, Matched, Chart, Daily, Projected’ information of the stock. Match equalizer function provided under Matched tab is a function that displays recently matched volume using an equalizer, which allows the user to intuitively understand momentary buy/sell strength.

