Stock Search Using Moving Average Line Support PDF
Stock Search Using Moving Average Line Support
Before searching stocks, the user must first decide the trading strategy to be used.
There are several types of stock trading strategy, but most of strategies excluding long-term investment and value investment are largely divided into two categories, advanced purchase strategy using support line and breakthrough strategy that uses breakthrough of a specific price (range).
If one of the two strategies is selected, the reference point of buy (sell) must be decided.
Reference point can be selected based on a specific price such as 52-week new high, year new high or highest in recent few days. It can also be based on a specific average price range such as 5-day, 20-day and 60-day moving average lines.
As such, the user can select a trading strategy and decide or change a reference point for trading. The foremost priority is to come up with a personal trading technique and an ideal reference point that can be applied to the trading technique.
Conditional search can be performed using “day / week / minute” charts. If day or minute chart search would be advantageous if the purpose is to engage in short-term trade using stocks searched. Week candle chart would be better if the purpose is to select stocks after consistent observation of search results.
In this section, search using week candle chart will be explained to understand the basic principle and method of using the screen.
『Searching of Stocks Showing Increase of Volume, Supported by 20-Week Line Based on Week Candle Chart』
Comparison of price-moving average: 20-week moving average line on week candle chart <= Close
Select [Technical Analysis → MA → Price-MA Comparison] among search conditions.
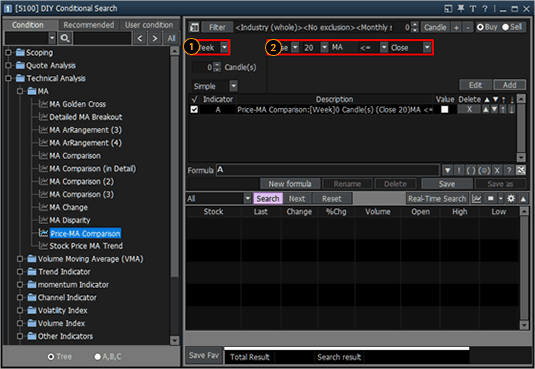
Select [Technical Analysis → MA → Price-MA Comparison] among search conditions.

Select “Week” among “Day/Week/Month/Min.”
Since this searches stocks supported by 20-day line on week candle chart, select “<=” so that close of the stock becomes greater than or equal to close of 20-week moving average line, and then click  button.
Trend of price moving average line: Rising trend of 20-week moving average line shown twice or more based on one candle on week candle chart
Since stock price is affected by rise and fall according to trend, trading success rate increases by searching stocks that are showing rising trend of 20-week moving average line on week candle chart.
Select [Technical Analysis → MA → Stock Price MA Trend] among search conditions.
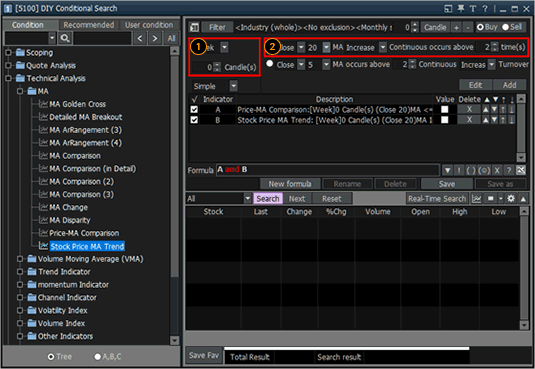
Since stock price is affected by rise and fall according to trend, trading success rate increases by searching stocks that are showing rising trend of 20-week moving average line on week candle chart.
Select [Technical Analysis → MA → Stock Price MA Trend] among search conditions.

Select week candle chart and select the reference candle. When selecting the reference candle, “0 Candle(S)” searches data based on the candle of previous day by selecting current candle as “1 Candle(S)”.
Select “20 MA Increase” so that 20-week moving average line on week candle chart can maintain a rising trend, and then click  button.
Trend of volume moving average line: Rising trend of 5-week moving average line shown twice or more on week candle chart
Movement of volume is also very important for stock price to increase. Therefore, it is desirable to search stocks whose volume is consistently increasing. To do so, latest trend of “volume moving average line” needs to show a rising trend.
Select [Technical Analysis → Volume Moving Average(VMA) → VMA Trend] among search conditions.
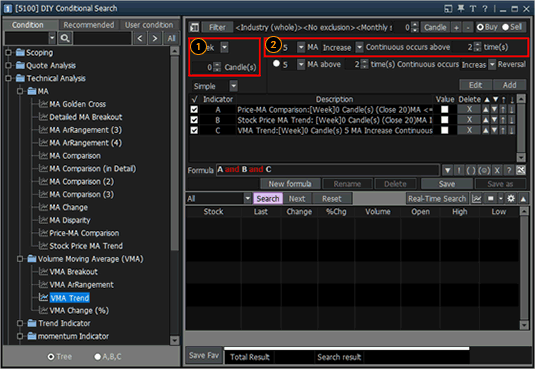

Select week candle chart and select the reference candle.
Select “5 MA Increase” so that 5-week moving average line on week candle chart can maintain a rising trend, and then click  button.
Search
Click button after finishing condition setting to view a list of stocks that fulfill the conditions.
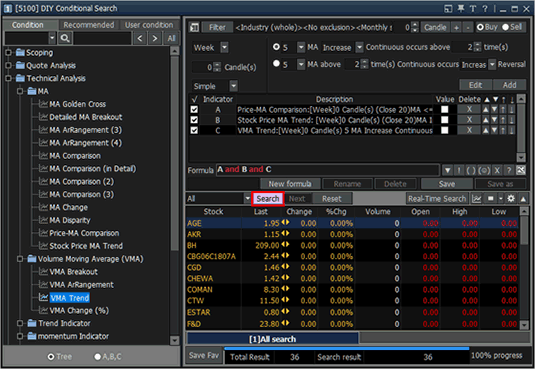
Click

Sequence search
Use “sequence” to apply the concept of time to the search conditions.
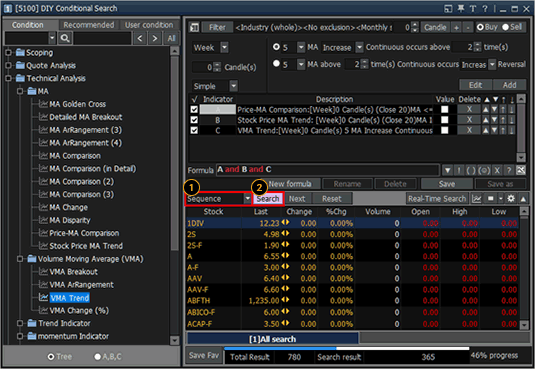
Use “sequence” to apply the concept of time to the search conditions.

Select Sequence.
Click  button to search stocks using sequence. Since stocks that fulfill the conditions are searched according to time sequence, the search results may differ.
Condition formula: [A and B and C] → [(A and B) or C]
Search conditions are added by connecting them using “and” condition. Parentheses and “or” conditions can be used to change the formula. In this example, [A and B and C] condition will be turned into [(A and B) or C].
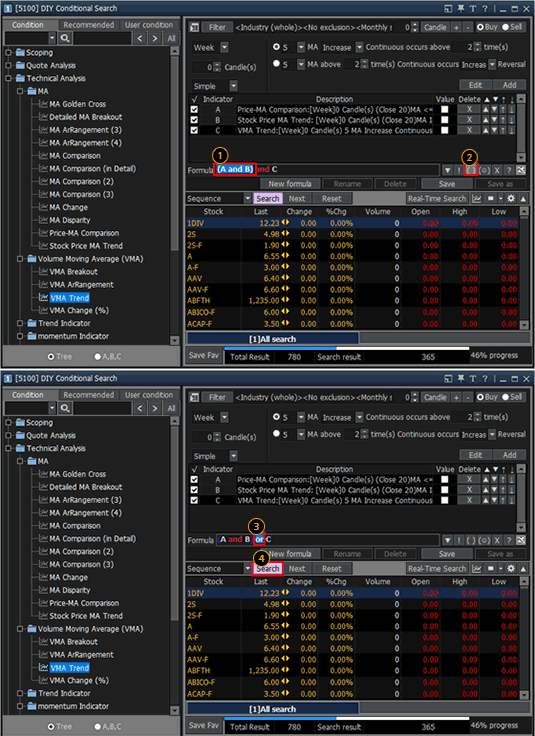
Search conditions are added by connecting them using “and” condition. Parentheses and “or” conditions can be used to change the formula. In this example, [A and B and C] condition will be turned into [(A and B) or C].

To change the condition formula using parentheses, drag the section to apply parentheses using mouse.
Click  button to add parentheses to the selected part of the formula.
Place the mouse cursor on the and condition to be turned into an or condition and double click it. The condition formula will be changed to [(A and B) or C].
Click  button to search “stocks that fulfill A and B conditions at the same time or fulfill C condition.” Different stocks appear in the search results because of parentheses and or condition.
Save condition
If the results of a condition formula are considered as efficient, the formula can be saved using ”Save condition” function.
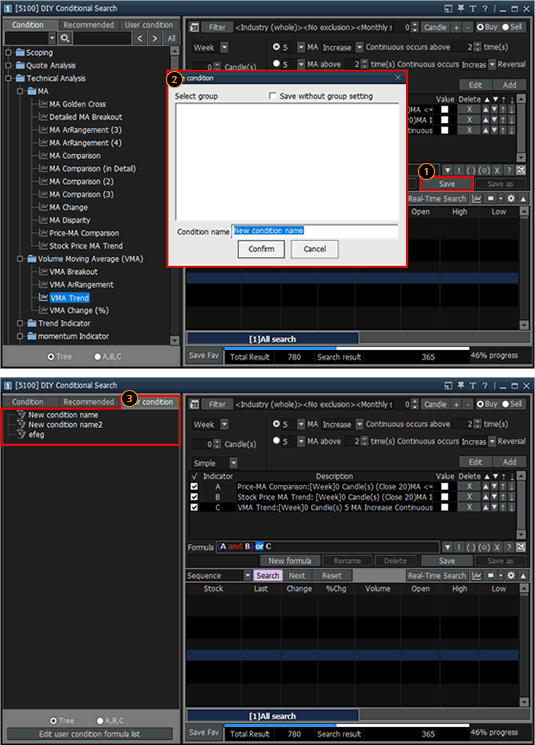
If the results of a condition formula are considered as efficient, the formula can be saved using ”Save condition” function.

Click  button to save the condition.
The save condition window is used to save the condition.
The saved condition can be used easily under the user condition tab.
