(FSS)(Hero) Order leverl 2 PDF
1. Overview of Screen
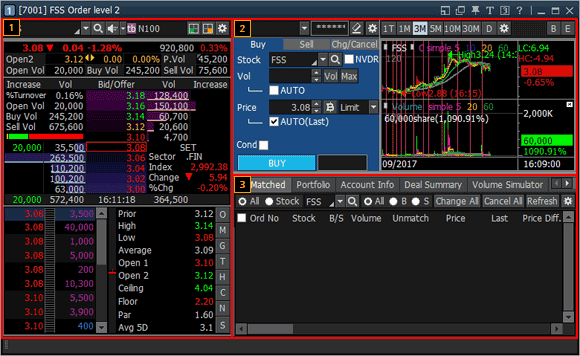
HERO Order Level 2 is comprised of 4 screens including price information window, order window, chart window and account information window.
Market and stock information is provided using bid/offer window, account information and buttons. Price view and order placement can be done on the same screen, and various chart information and account information necessary for trading are provided at the same time. In addition, a separate "Buy, Sell, Change/Cancel” order area is available to reduce steps to be taken to select and enter buy/sell order every time.
※ Caution If there is an unmatched sell order, simulation of orderable amount based on matching of additional sell order may not return accurate results. Therefore, make sure to estimate sellable amount when there is no unmatched sell order.
Market and stock information is provided using bid/offer window, account information and buttons. Price view and order placement can be done on the same screen, and various chart information and account information necessary for trading are provided at the same time. In addition, a separate "Buy, Sell, Change/Cancel” order area is available to reduce steps to be taken to select and enter buy/sell order every time.

※ Caution If there is an unmatched sell order, simulation of orderable amount based on matching of additional sell order may not return accurate results. Therefore, make sure to estimate sellable amount when there is no unmatched sell order.
2. Description of Screen
Bid/Offer Area
This is a bid/offer window that shows 5 best bids/offers of the selected stock. Remaining volume of each bid/offer can be determined intuitively by displaying remaining order volume of each bid/offer as numbers and bar graph in the background.
Also, data such as last and stock price trend of the stock are provided. Especially, the stock to be viewed can be selected. Price of stock group can be viewed using rotator function, and there is a menu function that allows the user to write down memo and create a simple user database for each stock.
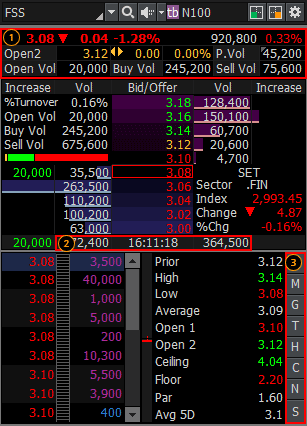

Last, change, percent change, volume, best bid/offer, stocks owned by foreigners and ratio can be viewed.
Click data to view difference in total remaining buy/sell volume.
Click buttons to open a related pop-up window and view respective data.
Order Area
When using unfolded order screen, orders are arranged in the order of “Buy, Change/Cancel, Sell” from the left so that the wanted order can be placed immediately using mouse without having to select an order type. Various layouts are provided to increase convenience of order placement.
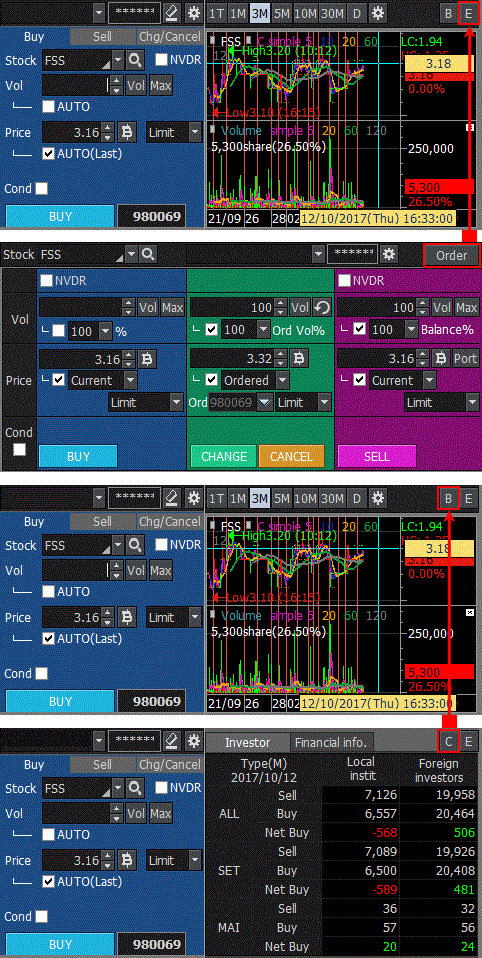
When using unfolded order screen, orders are arranged in the order of “Buy, Change/Cancel, Sell” from the left so that the wanted order can be placed immediately using mouse without having to select an order type. Various layouts are provided to increase convenience of order placement.

Buy order
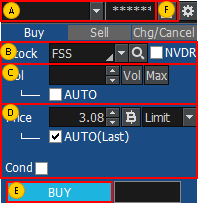

Select an account to execute a buy order.
Select a stock to order.
If is checked, a stock without voting right for the stock selected by the user is selected.
If
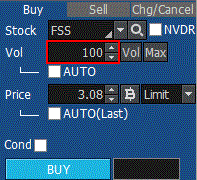
Directly enter order volume or click  and select volume on the volume selection pop-up window.
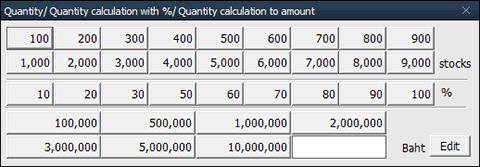
Click button to calculate maximum possible volume based on portfolio.
Check ‘AUTO’ item to automatically calculate volume based on % of portfolio selected by the user.
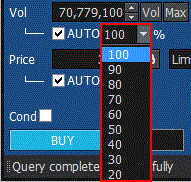

Click
Check ‘AUTO’ item to automatically calculate volume based on % of portfolio selected by the user.

Enter order price or click the “฿” button to select bid when the pop-up window appears. Designate price type. If 'AUTO (Last)' item is checked, last of the stock is entered automatically.
If ‘Cond’ item is checked, detailed order type can be selected.
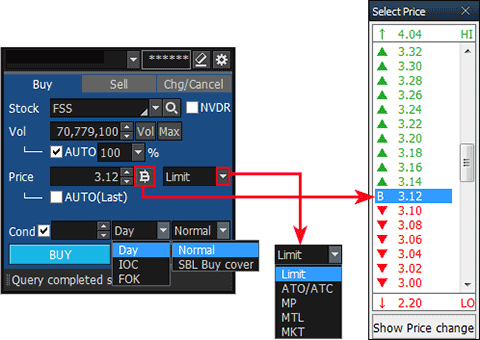
If ‘Cond’ item is checked, detailed order type can be selected.

Click  button to execute the buy order.
Click  button to delete all order details entered by the user and enter a new order.
Sell order
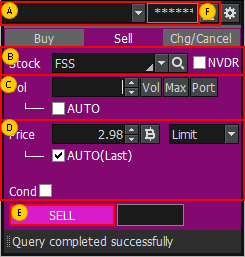

Select an account to place a sell order.
Select a stock to order.
If is checked, a stock without voting right for the stock selected by the user is selected.
If
Directly enter order volume or click  and select volume on the volume selection pop-up window.

Click button to calculate maximum possible volume based on portfolio.
Check ‘AUTO’ item to automatically calculate volume based on % of portfolio selected by the user.
Click button to open the portfolio pop-up window. Select portfolio from the pop-up window to place a sell order.

Click
Check ‘AUTO’ item to automatically calculate volume based on % of portfolio selected by the user.
Click
Enter order price or click the button to select offer when the pop-up window appears. Designate price type. If 'AUTO(Last)' item is checked, last of the stock is entered automatically. If ‘Cond’ item is checked, detailed order type can be selected
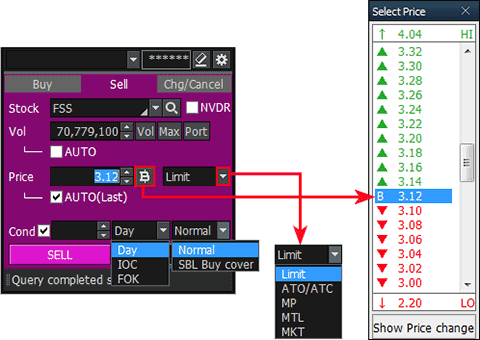

Click  button to execute the sell order.
Click  to delete all order details entered by the user and enter a new order.
Change/cancel order
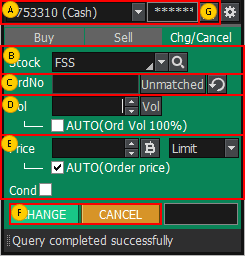

Select an account to place change/cancel order
Select a stock to order.
Enter original order number or click  tobutton and select an unmatched order from the unmatched order pop-up window.
Click button to delete original order number.
Click
Enter order volume or click  button to select volume. If 'AUTO (Order Vol 100%)' is checked, remaining unmatched volume is automatically entered according to % designated by the user
In case of change order, enter order price or click  button and select bid/offer from the bid/offer pop-up window. Designate price type. Check 'AUTO(Last)' item to enter last of the stock automatically. If ‘Cond’ item is checked, detailed order type can be selected. Items are not selected in case of cancel order.
Click  buttons to place the order.
Click  button to delete all details of order entered by the user and enter a new order.
Account Information Area
Information related to portfolio such as "Unmatched, Portfolio, Account Info, Deal Summary, Volume Simulator" is provided using tabs. In common, change all, cancel all and sell all orders can be placed by checking the check box next to the stock.
Information related to portfolio such as "Unmatched, Portfolio, Account Info, Deal Summary, Volume Simulator" is provided using tabs. In common, change all, cancel all and sell all orders can be placed by checking the check box next to the stock.
Order Status
Daily order status can be viewed.
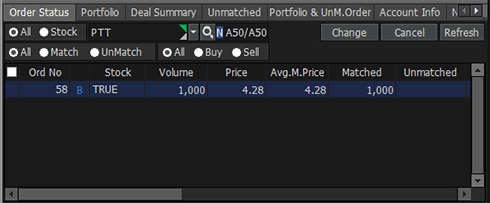
Daily order status can be viewed.

Portfolio
Various information about current account portfolio can be seen at a sight to identify account status of the user.
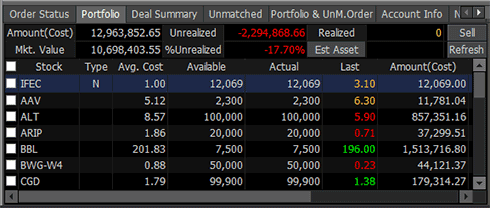
Various information about current account portfolio can be seen at a sight to identify account status of the user.

『Account Terms』
Amount(Cost): Buy amount when buying portfolio owned (buy amount + commission + fee + VAT)
Avg(Cost): Amount(Cost) / volume
Mkt.Value: Appraised value (volume * last price)
Unrealized: Sum of profit and loss from portfolio owned (Mkt.Value - Amount(Cost) - commission - fee – VAT)
%Unrealized: Sum of profit and loss from valuation of portfolio owned (Unrealized / Amount(Cost) * 100)
est asset: Cash balance + Mkt.Value
Realized: (Sell price – Avg(Cost)) * matched sell volume – commission – fee – VAT
Deal Summary
Detailed deal summary of the day can be viewed. Detailed history of daily buy and sell orders is shown.
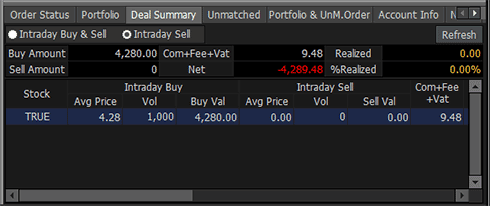
Detailed deal summary of the day can be viewed. Detailed history of daily buy and sell orders is shown.

UnMatched
Current unmatched order status can be viewed at a sight
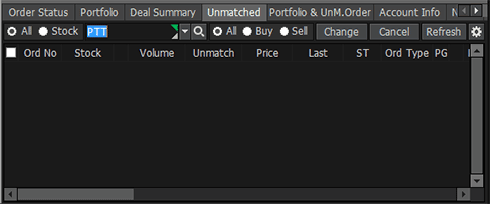
Current unmatched order status can be viewed at a sight

Portfolio & Unmatched Order
Portfolio and Unmatched order information can be viewed. ‘Change all/Cancel all’ order can be executed on unmatched orders.
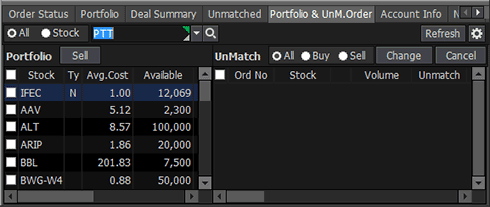
Portfolio and Unmatched order information can be viewed. ‘Change all/Cancel all’ order can be executed on unmatched orders.

Account Info
Current account information can be viewed.
Cash refers to cash in the cash account. Even if there are stocks in possession, cash is displayed as 0 if there is no cash in the account.
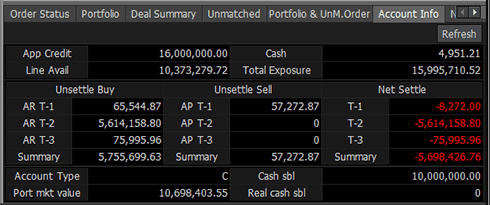
Current account information can be viewed.
Cash refers to cash in the cash account. Even if there are stocks in possession, cash is displayed as 0 if there is no cash in the account.

News
News for all stocks or news for the selected stock can be viewed.
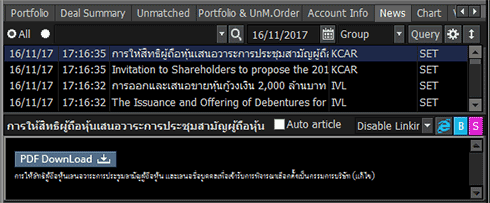
News for all stocks or news for the selected stock can be viewed.

Chart
The chart of the stock can be viewed. Indicators and analysis tools can be used in the same way as the general chart.
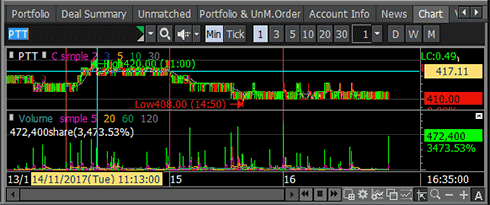
The chart of the stock can be viewed. Indicators and analysis tools can be used in the same way as the general chart.

Volume Simulator
‘PP, Buy allow volume, Total exposure’ can be viewed by entering stock and buy price.
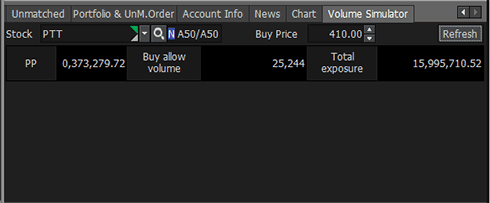
‘PP, Buy allow volume, Total exposure’ can be viewed by entering stock and buy price.

『Common Matters for Chart』
Chart Settings
Click the right mouse button on the chart and select ‘Chart setting' to configure detailed settings for the chart and screen. Chart margin, price information, screen display and scale settings can be saved. Settings can be saved as a style, and saved styles can be loaded as well.
Click the right mouse button on the chart and select ‘Chart setting' to configure detailed settings for the chart and screen. Chart margin, price information, screen display and scale settings can be saved. Settings can be saved as a style, and saved styles can be loaded as well.
Chart Property Settings
Chart property can be set to efficiently arrange various functions and data on the chart so that price flow and important matters can be checked at a glance.
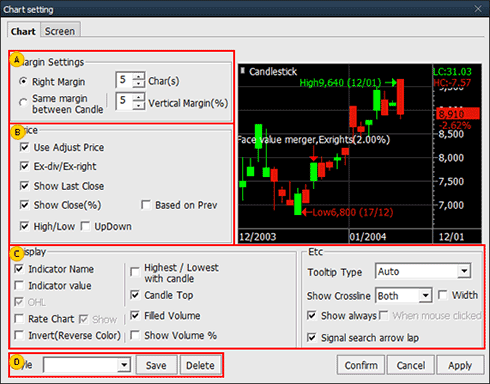
Chart property can be set to efficiently arrange various functions and data on the chart so that price flow and important matters can be checked at a glance.

Margin setting
Right margin of the chart can be set. Right margin of the chart can secure enough space to draw trend-line, enter text and forecast future price.
Right margin of the chart can be set. Right margin of the chart can secure enough space to draw trend-line, enter text and forecast future price.
Price
Use adjust price, ex-div/ex-right, show last close, percent change of close, and high/low can be selected.
※ Adjust price: Stock price of a company indicates change of capital. In other words, if there is a cause that affects capital of a company such as capital increase without consideration and capital reduction without refund, stock price is artificially adjusted by considering change in volume of capital. However, such artificial adjustment is not reflected on charts and various data, causing errors in stock price and various indicators during actual stock investment. Especially in charts, this greatly affects judgment of investors by influencing daily candle and various indicators. Adjust price is a price recalculated by accounting for factors of capital increase and capital decrease to prevent such distortion of stock price and indicate accurate price flow.
Display/Etc. setting
- Display: Items to be displayed on charts such as ‘Indicator Name/Indicator Value/Rate Chart’ can be selected. Method of visual display on graphics and charts such as ‘Highest/Lowest with Candle/Candle Top/Filled Volume' can be selected.
- Etc.: Options for efficient use of charts such as 'Tooltip Type/Always Show Cross Line/Show Cross Line When Mouse Clicked’ can be set.
※ Indicator Value/Rate Chart Select 'Indicator Value' to show various indicator values including moving average lines of stock price and volume on the chart. Select 'Rate Chart’ to show percent change (%) based on base price instead of stock price on the vertical axis (Y axis) of the chart.
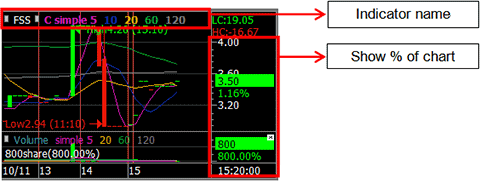
Indicator name input field, select “view as rate chart”
- Display: Items to be displayed on charts such as ‘Indicator Name/Indicator Value/Rate Chart’ can be selected. Method of visual display on graphics and charts such as ‘Highest/Lowest with Candle/Candle Top/Filled Volume' can be selected.
- Etc.: Options for efficient use of charts such as 'Tooltip Type/Always Show Cross Line/Show Cross Line When Mouse Clicked’ can be set.
※ Indicator Value/Rate Chart Select 'Indicator Value' to show various indicator values including moving average lines of stock price and volume on the chart. Select 'Rate Chart’ to show percent change (%) based on base price instead of stock price on the vertical axis (Y axis) of the chart.

Indicator name input field, select “view as rate chart”
Chart style can be selected among 'Default Style, Empty Candle, Fill Candle, Black Style, White Style’.
Chart Property Settings
Chart screen settings can set background color, type and color of different lines, and font color and size of each area by largely dividing the chart into 'Chart Area', 'Scale Area' and ‘Basic Font'. If chart background, line and font are configured efficiently on this screen, users who use computer for long time can greatly lessen stress of eyes and understand shapes of various indicators in greater details.
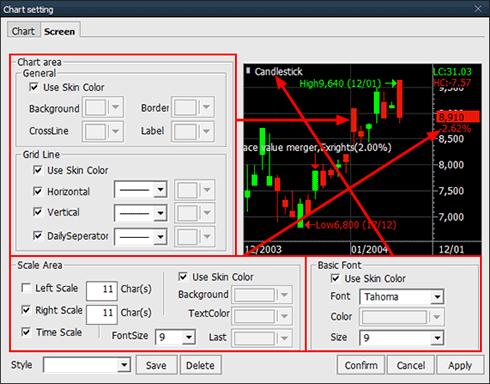
Chart screen settings can set background color, type and color of different lines, and font color and size of each area by largely dividing the chart into 'Chart Area', 'Scale Area' and ‘Basic Font'. If chart background, line and font are configured efficiently on this screen, users who use computer for long time can greatly lessen stress of eyes and understand shapes of various indicators in greater details.

Color setting
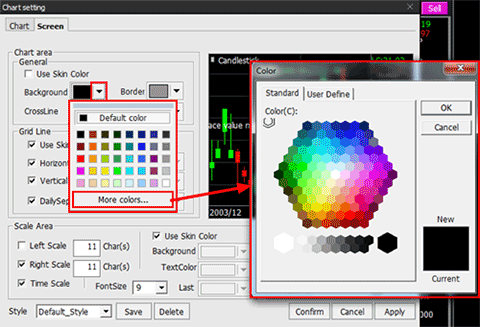

Click [▼] button of each item to open the basic color pop-up window.
Double click the color to be used among basic colors. To use a different color, click ‘More colors’ button.
Color can be selected under 'Standard' tab and 'User Define' tab. A color can be selected from the standard color table of OS under 'Standard' tab. In ‘User Define’ tab, the user can create a color to be used.
Common Chart Functions
Add indicator
Click the right mouse button on the chart and select "Add Indicator (A)" to add various indicators to the chart.
Double click an indicator and click Apply button to apply it to the chart.
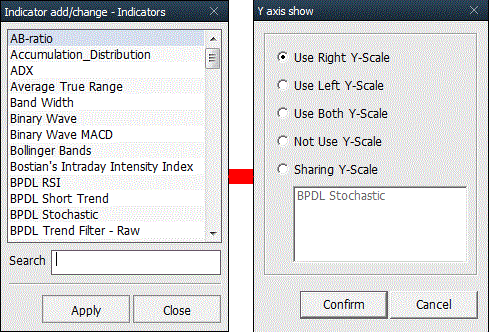
Click the right mouse button on the chart and select "Add Indicator (A)" to add various indicators to the chart.
Double click an indicator and click Apply button to apply it to the chart.

Overlap indicator
Click the right mouse button on the chart, select Add Indicator to Price Chart(I), and select an indicator under Indicator add/change – Indicators window to overlap the selected indicator on the stock chart.
※ For 'Overlap Indicator', select an indicator to be overlapped and select an area to display value of the new indicator being overlapped on the existing indicator on the ‘Y Axis Show' window. Then click button.
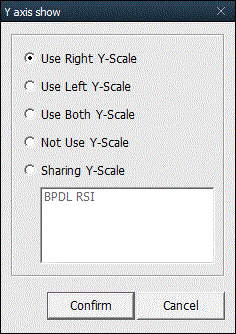
Click the right mouse button on the chart, select Add Indicator to Price Chart(I), and select an indicator under Indicator add/change – Indicators window to overlap the selected indicator on the stock chart.
※ For 'Overlap Indicator', select an indicator to be overlapped and select an area to display value of the new indicator being overlapped on the existing indicator on the ‘Y Axis Show' window. Then click

Change indicator
The selected indicator is applied instead of the existing indicator. Click the right mouse button on the indicator
The selected indicator is applied instead of the existing indicator. Click the right mouse button on the indicator
Magnifier
Magnifier can be used when the user feels difficulty viewing small screen or wants to view a specific part in greater detail. Click the right mouse button within the magnifier area to configure ‘Size/Magnification/Shape’.
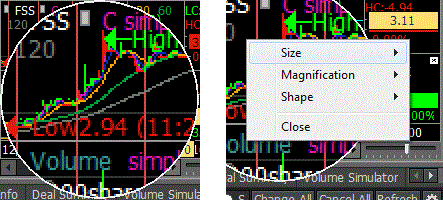
Magnifier can be used when the user feels difficulty viewing small screen or wants to view a specific part in greater detail. Click the right mouse button within the magnifier area to configure ‘Size/Magnification/Shape’.

Click  button to select period of the chart, view investor/financial information and use unfolded chart.
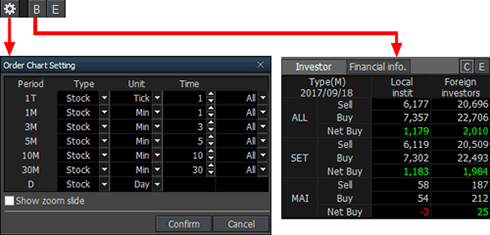

『Common Matters for Bid/Offer Area』
Selection of a stock to be viewed
Enter or select a stock to be viewed.

Enter or select a stock to be viewed.

Selection of a stock to be viewed
The user can directly enter a stock to be viewed.
Click  button to open a list of stocks previously viewed.


Click  next to stock name to see ‘Info’ and ‘Memo’ for the selected stock. Memo function allows the user to write down opinions and thoughts about a stock. This memo can be checked at any time on other screens. This is a simple user database for stocks that adds to price viewing function of the screen.
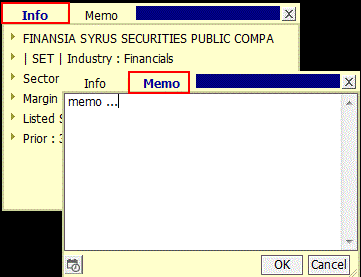

Selection of a stock to be viewed through search
Click button to open the ‘Search’ pop-up window and select a stock to be viewed.
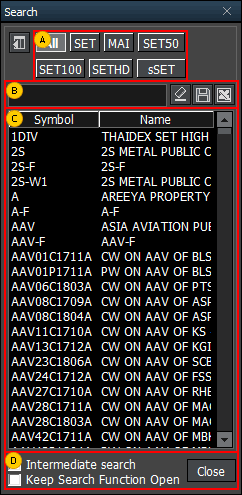
Click

Select a category to be viewed such as SET, MAI.
Directly enter a stock to be searched and viewed.
Click to save the search result as a TXT file on the user’s PC.
Click to save the search result as an Excel file on the user’s PC.
Click
Click
A list of stocks in the category selected in  or a list of stocks based on the search results described in
  is provided.
 or a list of stocks based on the search results described in
  is provided.
Intermediate Search and Keep Search Function Open functions can be selected
Signal mode / rotator mode functions
HERO FSS helps the user view stock price information by providing signal mode / rotator mode functions.
Click to set signal mode and rotator mode.
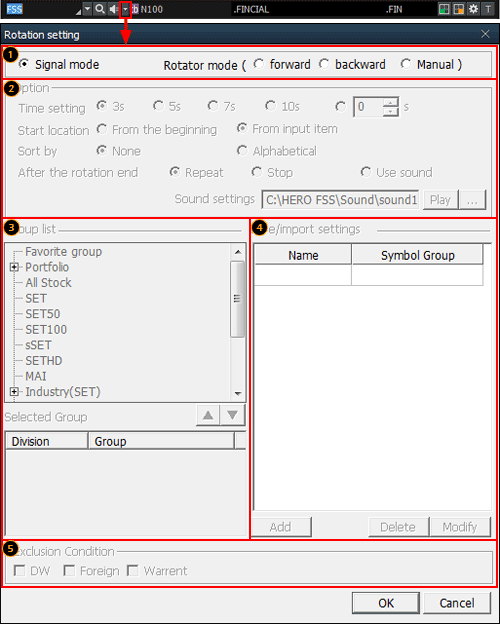
HERO FSS helps the user view stock price information by providing signal mode / rotator mode functions.
Click

Mode selection
Signal mode
This mode is a general mode that views price information of a stock selected by the user.
This mode is a general mode that views price information of a stock selected by the user.
Rotator mode
This is a mode that views price information of multiple socks according to the conditions set by the user (stock, direction, time, etc.).
This is a mode that views price information of multiple socks according to the conditions set by the user (stock, direction, time, etc.).
Forward: Price information of the selected stocks is rotated in forward direction of the list.
Backward: Price information of the selected stocks is rotated in backward direction of the list.
Manual: The user can manually click to decide rotating direction to view the selected stocks.
Stock rotator option
Time setting: Time of automatic rotation of stocks can be set.
Start location: A stock can be designated as the starting location on the list of stocks.
Sort by: Sorting order of the stock list can be set.
After the rotation end: Operation to be done after the end of rotation of the selected stocks can be set.
Sound setting: A wav file on the user’s PC can be selected
Designation of rotator stock list
Double click a group from the group list for rotator view or click button to show the selected group in the selected group area at the bottom.
One group or multiple groups can be selected.
Click button to delete the selected group.
Double click a group from the group list for rotator view or click
One group or multiple groups can be selected.
Click
After selecting the stock group for rotator view in  , click
  button to save the selected group.
 , click
 Exclusion condition can be set for the stocks selected for rotator view.
Change additional information
Click button at the top right corner of the screen to change additional information provided at the bottom.
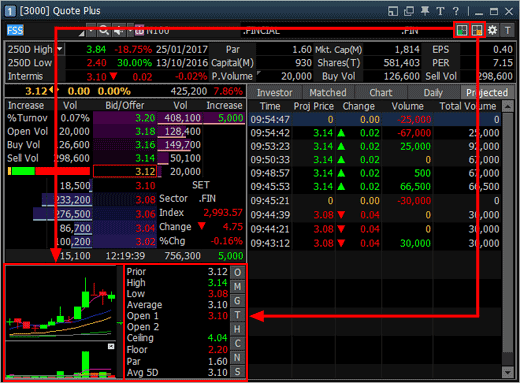
Click

Settings
Current price screens of HERO FSS can quickly recognize prices of stocks through various graphics and colors.
To fully utilize such functions, click button at the top of the screen and select desired options.
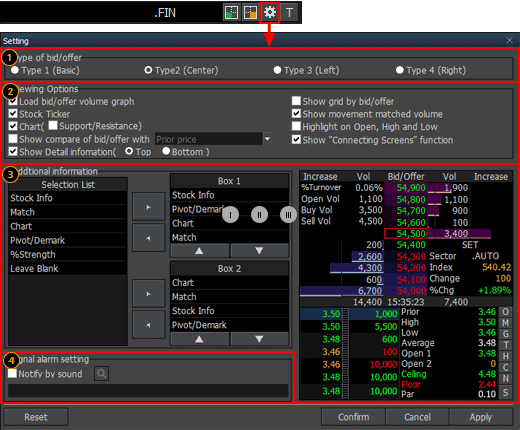
Current price screens of HERO FSS can quickly recognize prices of stocks through various graphics and colors.
To fully utilize such functions, click

Type of bid/offer setting
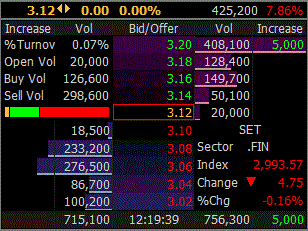
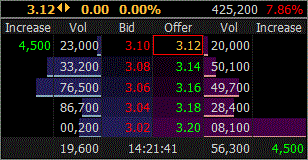
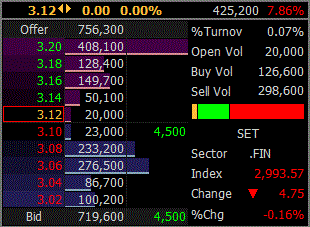
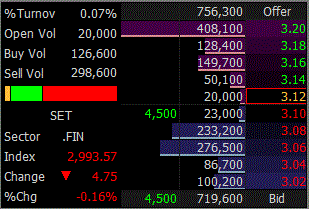
One of 4 types including ‘Basic, Center, Left and Right’ can be selected according to position of bid/offer data.
Basic Type divides bid and offer into left and right sides and arranges prices vertically. This type can clearly distinguish between bid status and offer status.
Center Type divides bid and offer into left and right sides around the center, allowing for easy analysis of bid and offer information.
Left Type and Right Type align bid/offer information in a line on the left side or right side.
Finansia HERO offers different types of bid/offer alignment and additionally provides a graph that shows remaining volume of each bid/offer price. User convenience was maximized to intuitively recognize bid/offer information by providing different bid/offer arrangement types and graph for remaining volume of each bid/offer price.
Type 1 (Basic)

Type 2 (Center)

Type 3 (Left)

Type 4 (Right)

Viewing options
Load bid/offer volume graph: Bid/offer volume is displayed as a graph.
Show gird by bid/offer: Bid/offer grid display can be set.
Stock ticker: Stock ticker display can be set.
Show movement matched volume: Instantaneous match volume equalizer display of (hourly) match tab can be set.
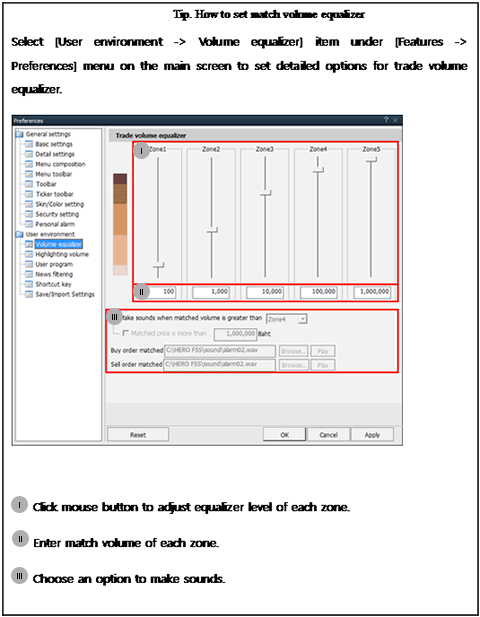

Chart: Chart display and support/resistance display on the chart can be set.
Highlight on open, high and low: Display of highlight on daily open, high and low prices can be set.
Show compare of bid/offer with ‘prior price’: Percent change can be viewed with prior price/open/high/low condition.
Show connecting screens function: Display of connecting screen button in the bid/offer area can be set. Selection O,M,G,T,H,C,N,S buttons to be also linked that screen.
Show detail information: Location of detailed stock information such as ‘250D High, 250D Low, PreOpen2, and P/E’ provided at the top of the screen can be selected.
Additional information
Additional information provided when  button is clicked at the top right corner of the screen can be set.
Up to 4 items can be set each for the top and the bottom. Order of items can be changed using buttons or mouse drag & drop.
Up to 4 items can be set each for the top and the bottom. Order of items can be changed using
Signal alarm setting: Signal alarm setting can be set by selecting a sound to be used.
『Common Matters for Order Area』
Order Settings
The order screen of Finansia HERO allows for fast and convenient trading through configuration of trading volume and price settings.
In addition, various setting options are designed so that the user can decide settings based on personal trading environment and style, thus maximizing efficiency of trading. Various setting values are automatically changed on the trading window in real time when the stock is changed or bid/offer changes.
Basic
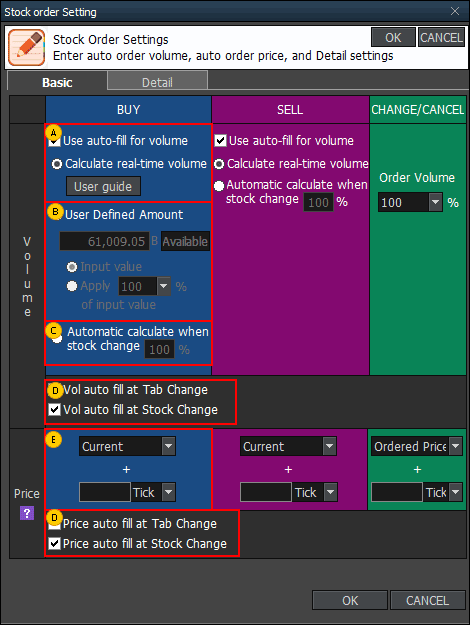

Auto-fill for volume: Auto-fill for volume is a function that automatically fills volume reflecting account information such as deposit and portfolio, as well as real-time price, so that orders can be placed immediately.

User Defined Amount: Order amount can be adjusted by setting as a ratio of input value.
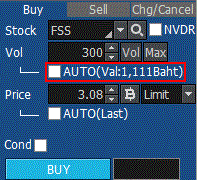
Ex) If 1,111 is entered into User Defined Amount and ‘Input value’ is selected, volume is calculated automatically based on 1,111 Baht entered by the user. If 50% is selected, volume is calculated to be 555 Baht (1,111 Baht × 50%).

Ex) If 1,111 is entered into User Defined Amount and ‘Input value’ is selected, volume is calculated automatically based on 1,111 Baht entered by the user. If 50% is selected, volume is calculated to be 555 Baht (1,111 Baht × 50%).
Automatic calculate when stock change: Order volume can be entered in %.
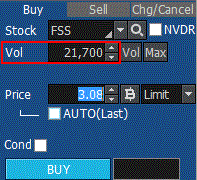

When changing tab or stock, order volume and price can be filled automatically.
If 'Price auto fill at stock change' item is selected, bid/offer price is filled automatically as price of “Buy, Change/Cancel or Sell” order whenever stock is changed.
If 'Price auto fill at stock change' item is selected, bid/offer price is filled automatically as price of “Buy, Change/Cancel or Sell” order whenever stock is changed.
Order price is entered automatically according to designated tick or %.
Detail
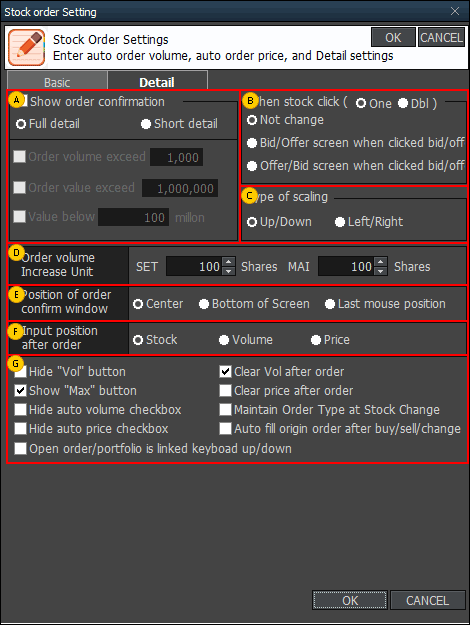

Order confirmation can be shown in full detail or short detail.
Event for one clicking or double clicking of stock can be selected.
Type of scaling buttons can be selected between up/down and left/right.
Increase unit of order volume can be designated by the user. Default order volume is 100 or 50 stocks depending on price, but it can be set by the user for fast order placement considering size of deposit in the user’s account.
Position of the order confirmation window can be designated.
Input position after order can be designated.
Various options such as showing of order window buttons can be set.
『Order Type』
Limit : Limit order is an order to buy or sell at a specified price.
MKT(Market Order) : A market order is an order to buy or sell a stock at the best available price. A market order can be matched at more than one price level. Unmatched quantity (if any) will be automatically cancelled. Market orders are allowed only during open trading sessions.
MP(Special Market Order) : A special market order is an order to buy or sell a stock at the best available price. Such an order can be matched at more than one price level. Unmatched quantity (if any) will be converted to a limit order at a price of one tick better than the last executed price. Special market orders are allowed only during open trading sessions.
MTL(Market-to-Limit Order) : A market-to-limit order is submitted as a market order to execute at the current best market price only. Unmatched quantity (if any) will be converted to a limit order at price equal to the last executed price. Market-to-limit orders are allowed only during open trading sessions.
ATO(At-The-Open Order) : An order to buy or sell a stock at the session’s opening price. ATO orders are allowed during pre-open sessions (morning and afternoon).
ATC(At the Close Order) : An order to buy or sell a stock at the closing price. ATC orders are allowed only during pre-close sessions.
IOC(Immediate-Or-Cancel Order) : An order to buy or sell a stock immediately at a specific price (limit order) on the condition that any remaining portion of the trade which is unmatched will be cancelled. IOC orders are allowed only during open trading sessions and are not allowed to be used with an Iceberg order or any market order type.
FOK(Fill-Or-Kill Order) : An order to place a trade immediately and completely at a specified price (limit order); if the specified conditions cannot be met immediately, the order is cancelled. FOK orders are allowed only during open trading sessions, and are not allowed to be used with an Iceberg order or any market order type.
Publish(Iceberg Order) : An iceberg order is a high volume order that has been equally subdivided into smaller lots so that only the portion of the total order which is currently being executed is visible. The broker specifies the subdivided portion of the order to be published in the order book. When the published portion of the order is executed, the next remaining suborder is made available for trade until the entire high-volume order has been executed.
An Iceberg order is allowed only during open trading sessions, must be a limit-price order, and must be divided into no more than 100 suborders. Any unmatched portions of an Iceberg order in each trading session will be automatically cancelled by the system. In addition, when the trading of a particular stock is halted, all unmatched volume of Iceberg orders will be automatically cancelled.
* Source of data: SET
