[6000] Technical Chart PDF
1. Overview of Screen
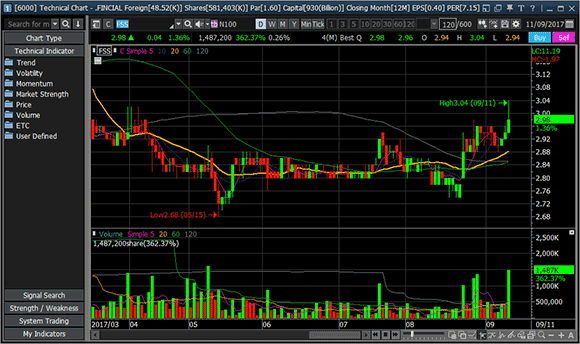
※ Among supplementary indicators on the chart, volume owned by institutions is a relative value based on the base date (600 days ago) because absolute value of stock volume owned by institutions is unknown. This may result in a negative value.
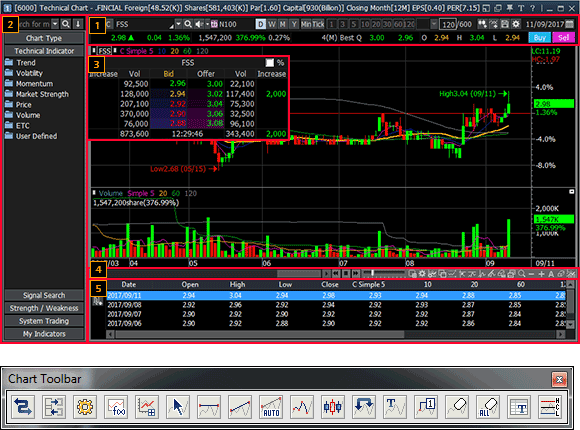
2. Details of Screen
[6000] Technical Chart screen is divided into 6 parts including 'Top Menu and Basic Quote, Left Menu,
Mini-Quote, Bottom Menu, Data Table, and Chart Toolbar’.


Top Menu and Basic Quote
The top menu is provided to select the stock to be viewed, set period of view, and select day/week/month and minute/tick chart. Basic quote shows basic quote information including last, change, percent change, turnover, and open/high/low.
The top menu is provided to select the stock to be viewed, set period of view, and select day/week/month and minute/tick chart. Basic quote shows basic quote information including last, change, percent change, turnover, and open/high/low.

Click [▼] button to select a target area to be viewed between ‘Stock/Industry’. A stock or
industry in the selected target area can be selected.
View date and number of data can be set. Number of viewable data is about 900. Click  button on the side to increase the number of view (for
3 months). Number of data to be viewed on the screen can be entered. Also, view date can be selected by clicking
 .
.
Day/week/month/minute/tick chart and chart cycle or time unit can be selected.
Left Menu
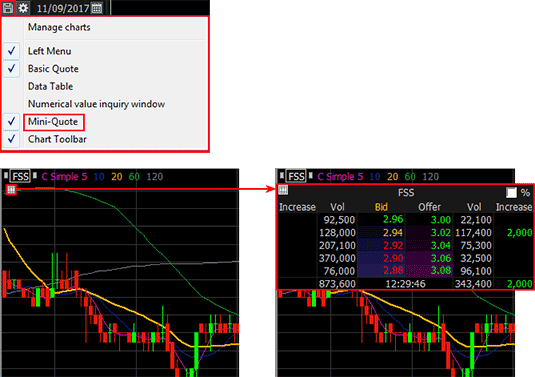

Mini-Quote
Mini-Quote is a function that views 5-step bid/offer of a stock on the chart. To view mini-quote, click  at the top right corner of the chart and select
‘Mini-Quote’ or click on the chart.


Bottom Menu
A scroll bar to view current and previous charts, chart zooming bar, and various function buttons are available
at the bottom of the chart.

 : Tool buttons displayed on the chart can be edited on
the ‘Edit Chart Tool Buttons' pop-up window.
 : Chart type, color and functions can be set on the
‘Chart Settings’ pop-up window.
 : An indicator can be selected for display on the
'Add/Change Indicator-Technical Indicator’ pop-up window.
 : Quote data for time/date where the mouse cursor is
located can be viewed on the ‘Data' pop-up window.
 : This is ‘Screen Max/Min Setting' button. Click this
button to open the ‘Screen Max/Min Setting’ pop-up window. The user can set value type and maximum and minimum
values to be displayed n the chart.
 : Click this button to draw ‘Cross/Horizontal
Line/Vertical Line’ on the chart.
 : This is ‘Magnify' button. Click this button and move
the mouse cursor on the chart to magnify the area covered by the mouse cursor.
 : Click these buttons to sequentially ‘Zoom Out/Zoom
In’ on the chart. ‘Number of Screen Display’ and ‘View All’ can be executed.

『Tool Buttons』
Data Table
Daily data of the stock shown on the chart can be viewed. Available data include quote information such as
open/high/low/close and daily trend of technical indicators set for the chart.

Click this button after selecting data items to be saved among data of the stock shown to save
‘’daily/hourly’ data.
Click this button to close the data table.
Chart Toolbar
This is a toolbar that contains tools for chart analysis. Various analysis tools can be used to draw trend lines, insert geometric figures, and view analysis data such as automatic trend line, price pattern and candle pattern.
Click to open the 'Edit Chart Tools' pop-up window.
Icons to be applied to the chart toolbar can be selected for three areas, 'Chart Settings/Analysis Tools/Chart
Type’.
[[ - Chart Settings - ]]

 Switch
Click this button to switch from toolbar 1 to toolbar 2.

 Edit Chart Tools
When this button is clicked, the toolbar edit window appears.
This window can be used to add, delete and edit toolbar 1 and toolbar 2 as wanted by the user

 Return to Basic Chart
When this button is clicked, the chart area is reset to the initial settings.
The initial settings are comprised of price chart, 5 price moving average lines, and volume.

 Chart Settings
When this button is clicked, the chart settings appear as a pop-up window.
General properties of the chart can be configured on the chart settings window.

 Chart Type Setting
When this button is clicked, the price chart type setting appears as a pop-up window.
Properties of each price chart type can be set.

 Add Indicator
When this button is clicked, the indicator list appears as a pop-up window.
Select an indicator from the indicator list to add the indicator at the bottom of the chart area.

 Add Signal Search
Click this button to open the condition search list pop-up window.
Select a search condition to indicate the date that satisfies the condition with an arrow in the chart area.

 Add Trading Strategy
Click this button to open the strategy list pop-up window.
Select a strategy from the strategy list to indicate the trading strategy with an arrow in the chart area.

 Add Strength/Weakness
When this button is clicked, the conditional search list appears as a pop-up window.
Select a condition to search to indicate dates that satisfy the condition in the price chart area using arrows.

 Add Trading Strategy
When this button is clicked, the strategy list appears as a pop-up window.
Select a strategy from the strategy list to indicate the trading strategy in the price chart area using arrows.

 Add Bull and Bear
When this button is clicked, the bull and bear list appears as a pop-up window.
Select a type of bull and bear to distinguish between bull and bear in the chart area using background colors.

 Formula Manager
When this button is clicked, the formula manager appears as a pop-up window. The user can create unique
descriptive indicators and functions. User indicators under Descriptive Indicator tab and user functions under User Function tab can be edited, but descriptive indicators and basic functions cannot be edited.

 Magnifier
When this button is clicked, the mouse pointer is enlarged and displayed as a magnifier.

 Automatic Trend Line
When this button is clicked, direction of stock price is automatically determined to draw a trend line using
wave turns configured by the user.

 Automatic Pattern
Analysis
When this button is clicked, specific patterns are automatically displayed on the chart.
Supported patterns include the following.
- Head and Shoulders Top / Bottom
- Double Top / Bottom
- Symmetrical / Upward / Downward Triangle

 Candle Pattern
Analysis
When this button is clicked, all candle patterns are indicated on the chart using arrows. Place the mouse pointer on an arrow to display date and pattern name in a balloon tip. Double click an arrow to display the candle pattern pop-up window comprised of mini chart and description.

 Numerical Value View
Window
When this button is clicked, the data pop-up window appears. Numerical values are shown on the data window based on movement of the mouse.

 Text Window

 Data Table
When this button is clicked, a data grid is generated at the bottom of the chart. All data on the chart appear in the grid, and data can be saved.

 Base Line Setting
When this button is clicked, the base line setting window appears.
Value entered by the user on the setting window is displayed as a line in the chart area.

 Variable Optimization

 Indicator
Optimization

 Time Optimization
[[ - Analysis Tools - ]]

 Cancel Trend Line
Creation
When a trend line is selected and added in the analysis tools, continuous copying is done. This button changes the mouse cursor performing continuous copying into a mouse pointer.

 Linear Trend Line
A linear trend line can be added. The linear trend line can find out a trend (up, down, flat) by connecting two low points or two high points.

 Copy Trend Line

 Fibonacci Arc
This refers to the Fibonacci arc. Drag from a point selected by the user (high point or low point) and drop at another point (low point or high point) to create an arc trend line. Trend is analyzed based on position of the arc and stock price (resistance, support, breakthrough) from the right side of the center line.

 Fibonacci Fan Line
This refers to the Fibonacci fan. Drag from a point selected by the user (high point or low point) and drop at another point (low point or high point) to create a Fibonacci line in the form of a right-angled triangle. A line is created on the vertical edge of the right-angled triangle at ratios of 23.6, 38.2, 50 and 61.8. Trend is analyzed based on position of this line and stock price (resistance, support, breakthrough).

 Fibonacci Time Zone
Progress of time is displayed using the Fibonacci sequence.

 Fibonacci Retracement
This refers to the Fibonacci retracement. Drag from a point selected by the user (high point or low point) and drop at another point (low point or high point) to create a zone line. This line is used to calculate Fibonacci target price. This function can identify retracement that corresponds to 23.6%, 38.2%, 50% and 61.8% compared to rise (or fall).

 Automatic Trine Lines
Trine lines can be added.

 Automatic Quadrant
Lines
Quadrant lines can be added.

 Trine Lines
Trine lines can be added.

 Quadrant Lines
Quadrant lines can be added.

 Linear Regression
Line
When high point and low point formed on the chart are connected, parallel lines appear inside the connected area. These parallel lines indicate trend inside the selected area.

 Linear Regression Channel
When high point and low point formed on the chart are connected, three parallel lines in the connected area are displayed as a channel. The top line is the resistance line, the bottom line is the support line, and the center

 line is the trend
line.
Support and Resistance Lines Support and resistance lines are added.

 Cycle Section
A cycle section is added.

 Gann Angle
A Gann angle is added.

 Adjusted Percentile
An adjusted percentile is added.

 Andrew’s Pitchfork
This is called Andrew’s pitchfork and is comprised of three parallel trend lines. Based on the leftmost point, two points to the right indicate support and resistance for the first point. To use Andrew’s pitchfork, the user selects a meaningful low point or high point (which must be in the leftmost position) and then selects second and third points that are on the right side of the first point. Three parallel trend lines are created. If the second point is a low point (high point), the third point must be a high point (low point).

 Elliott Wave Line
Elliott wave line is displayed in the chart area. When the line is double clicked, the user can decide general settings for the wave line.

 Cross Lines
Cross lines are added.

 Delete Trend Line
When this button is clicked, the latest trend line added is deleted one by one.

 Delete All Trend
Lines
When this button is clicked, all trend lines are deleted.

 Horizontal Line
A horizontal line is added.

 Vertical Line
A vertical line is added.

 Rectangle
This button is used when stock price is in a box area or by adding a rectangle to emphasize a part.

 Ellipse
An ellipse is added for emphasis.

 Acceleration Resistance
Fan Lines
This is a concept that expands the Fibonacci lines. Drag from a point (high point or low point) selected by the user and drop at another point (low point or high point) to create fan lines. The fan lines create right-angled triangles that are symmetric to one another using the line connected by the user at the center (forming a rectangle). Each right-angled triangle can be analyzed in the same way as the Fibonacci lines.

 Acceleration Resistance
Arc
This arc is based on a thought that rise or fall of stock price can be adjusted by the Fibonacci ratio.

 Gann fan
A Gann fan is added by selecting a point on the chart, selecting an angle, and dragging and dropping the mouse pointer. This Gann fan was designed based on the relationship between time and price, showing 9 angles. The 9 angles include (1×8(82.5 degrees) 1×4(75 degrees) 1×3(71.25 degrees) 1×2(63.75 degrees) 1×1(45 degrees: Positioned at the center. Point of drag & drop becomes the position of 45 degrees.) 2×1(26.25 degrees) 3×1(18.75 degrees) 4×1(15 degrees) 8×1(7.5 degrees)). Angle above 45 degrees indicates a bull market, and angle below indicates a bear market. They mean support and resistance. Trend is said to have been changed when leaving this angle range.

 Textbox
A text is added.

 Gann line
A Gann line is added.

 Price Change Line
This is a function to count price data of a chart. When the user selects an area on the chart, number of candles, average price and percent change are displayed based on the base candle.

 Pencil
When this button is clicked, the user can freely draw a line on the cart.

 Insert Figure
When this button is clicked, text and various icons can be added.
[[ - Chart Type - ]]

 Candle Chart

 Bar Chart (Open, High, Low, Close)

 Bar Chart (High, Low, Close)

 Close Line Chart

 Area Chart

 P&F Chart

 Three Line Break

 Swing Chart

 Kagi Chart

 Renko Chart

 Counter Clock Curve

 Candle Volume Chart

 Equi Volume Chart

 Flow Chart

 Distributed Chart

 Rainbow Chart

 Zigzag Chart
This is a toolbar that contains tools for chart analysis. Various analysis tools can be used to draw trend lines, insert geometric figures, and view analysis data such as automatic trend line, price pattern and candle pattern.
Click
[[ - Chart Settings - ]]
Click this button to switch from toolbar 1 to toolbar 2.
When this button is clicked, the toolbar edit window appears.
This window can be used to add, delete and edit toolbar 1 and toolbar 2 as wanted by the user
When this button is clicked, the chart area is reset to the initial settings.
The initial settings are comprised of price chart, 5 price moving average lines, and volume.
When this button is clicked, the chart settings appear as a pop-up window.
General properties of the chart can be configured on the chart settings window.
When this button is clicked, the price chart type setting appears as a pop-up window.
Properties of each price chart type can be set.
When this button is clicked, the indicator list appears as a pop-up window.
Select an indicator from the indicator list to add the indicator at the bottom of the chart area.
Click this button to open the condition search list pop-up window.
Select a search condition to indicate the date that satisfies the condition with an arrow in the chart area.
Click this button to open the strategy list pop-up window.
Select a strategy from the strategy list to indicate the trading strategy with an arrow in the chart area.
When this button is clicked, the conditional search list appears as a pop-up window.
Select a condition to search to indicate dates that satisfy the condition in the price chart area using arrows.
When this button is clicked, the strategy list appears as a pop-up window.
Select a strategy from the strategy list to indicate the trading strategy in the price chart area using arrows.
When this button is clicked, the bull and bear list appears as a pop-up window.
Select a type of bull and bear to distinguish between bull and bear in the chart area using background colors.
When this button is clicked, the formula manager appears as a pop-up window. The user can create unique
descriptive indicators and functions. User indicators under Descriptive Indicator tab and user functions under User Function tab can be edited, but descriptive indicators and basic functions cannot be edited.
When this button is clicked, the mouse pointer is enlarged and displayed as a magnifier.
When this button is clicked, direction of stock price is automatically determined to draw a trend line using
wave turns configured by the user.
When this button is clicked, specific patterns are automatically displayed on the chart.
Supported patterns include the following.
- Head and Shoulders Top / Bottom
- Double Top / Bottom
- Symmetrical / Upward / Downward Triangle
When this button is clicked, all candle patterns are indicated on the chart using arrows. Place the mouse pointer on an arrow to display date and pattern name in a balloon tip. Double click an arrow to display the candle pattern pop-up window comprised of mini chart and description.
When this button is clicked, the data pop-up window appears. Numerical values are shown on the data window based on movement of the mouse.
When this button is clicked, a data grid is generated at the bottom of the chart. All data on the chart appear in the grid, and data can be saved.
When this button is clicked, the base line setting window appears.
Value entered by the user on the setting window is displayed as a line in the chart area.
[[ - Analysis Tools - ]]
When a trend line is selected and added in the analysis tools, continuous copying is done. This button changes the mouse cursor performing continuous copying into a mouse pointer.
A linear trend line can be added. The linear trend line can find out a trend (up, down, flat) by connecting two low points or two high points.
This refers to the Fibonacci arc. Drag from a point selected by the user (high point or low point) and drop at another point (low point or high point) to create an arc trend line. Trend is analyzed based on position of the arc and stock price (resistance, support, breakthrough) from the right side of the center line.
This refers to the Fibonacci fan. Drag from a point selected by the user (high point or low point) and drop at another point (low point or high point) to create a Fibonacci line in the form of a right-angled triangle. A line is created on the vertical edge of the right-angled triangle at ratios of 23.6, 38.2, 50 and 61.8. Trend is analyzed based on position of this line and stock price (resistance, support, breakthrough).
Progress of time is displayed using the Fibonacci sequence.
This refers to the Fibonacci retracement. Drag from a point selected by the user (high point or low point) and drop at another point (low point or high point) to create a zone line. This line is used to calculate Fibonacci target price. This function can identify retracement that corresponds to 23.6%, 38.2%, 50% and 61.8% compared to rise (or fall).
Trine lines can be added.
Quadrant lines can be added.
Trine lines can be added.
Quadrant lines can be added.
When high point and low point formed on the chart are connected, parallel lines appear inside the connected area. These parallel lines indicate trend inside the selected area.
When high point and low point formed on the chart are connected, three parallel lines in the connected area are displayed as a channel. The top line is the resistance line, the bottom line is the support line, and the center
Support and Resistance Lines Support and resistance lines are added.
A cycle section is added.
A Gann angle is added.
An adjusted percentile is added.
This is called Andrew’s pitchfork and is comprised of three parallel trend lines. Based on the leftmost point, two points to the right indicate support and resistance for the first point. To use Andrew’s pitchfork, the user selects a meaningful low point or high point (which must be in the leftmost position) and then selects second and third points that are on the right side of the first point. Three parallel trend lines are created. If the second point is a low point (high point), the third point must be a high point (low point).
Elliott wave line is displayed in the chart area. When the line is double clicked, the user can decide general settings for the wave line.
Cross lines are added.
When this button is clicked, the latest trend line added is deleted one by one.
When this button is clicked, all trend lines are deleted.
A horizontal line is added.
A vertical line is added.
This button is used when stock price is in a box area or by adding a rectangle to emphasize a part.
An ellipse is added for emphasis.
This is a concept that expands the Fibonacci lines. Drag from a point (high point or low point) selected by the user and drop at another point (low point or high point) to create fan lines. The fan lines create right-angled triangles that are symmetric to one another using the line connected by the user at the center (forming a rectangle). Each right-angled triangle can be analyzed in the same way as the Fibonacci lines.
This arc is based on a thought that rise or fall of stock price can be adjusted by the Fibonacci ratio.
A Gann fan is added by selecting a point on the chart, selecting an angle, and dragging and dropping the mouse pointer. This Gann fan was designed based on the relationship between time and price, showing 9 angles. The 9 angles include (1×8(82.5 degrees) 1×4(75 degrees) 1×3(71.25 degrees) 1×2(63.75 degrees) 1×1(45 degrees: Positioned at the center. Point of drag & drop becomes the position of 45 degrees.) 2×1(26.25 degrees) 3×1(18.75 degrees) 4×1(15 degrees) 8×1(7.5 degrees)). Angle above 45 degrees indicates a bull market, and angle below indicates a bear market. They mean support and resistance. Trend is said to have been changed when leaving this angle range.
A text is added.
A Gann line is added.
This is a function to count price data of a chart. When the user selects an area on the chart, number of candles, average price and percent change are displayed based on the base candle.
When this button is clicked, the user can freely draw a line on the cart.
When this button is clicked, text and various icons can be added.
[[ - Chart Type - ]]
View
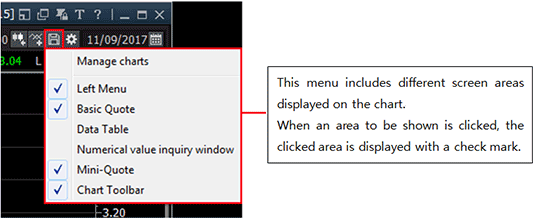
View allows the user to select basic parts of the [6000] Technical Chart screen or set additional screen configuration. Screen configuration can be selected by clicking the button at the top right corner of the screen.

 Save/Delete Chart Frame
Current chart settings can be saved/deleted as a chart frame. If chart settings are saved as a chart frame, the user can view a desired chart simply by loading a saved chart frame without having to configure new chart settings. This chart frame save function allows the user to utilize charts more efficiency by saving and loading different settings appropriate for various stock market situations and stocks.
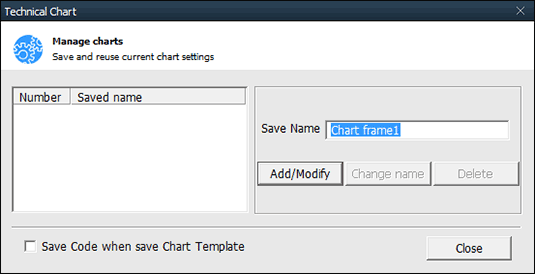
Save: Click to open
the ‘Chart Frame Save/Delete' pop-up window. Enter name of the chart frame into Save Name field on the pop-up
screen and click ‘Add’ button.
Delete: List of saved chart frames can be viewed at the top of the ‘Chart Frame Save/Delete’ window. Select chart frames to be deleted from this list and click ‘Delete’ button.
Change name: To change name of an existing chart frame, select a chart frame to be renamed from the chart frame list at the top. Enter new save name into Save Name field and click ‘Change name’ button.
View allows the user to select basic parts of the [6000] Technical Chart screen or set additional screen configuration. Screen configuration can be selected by clicking the button at the top right corner of the screen.

Current chart settings can be saved/deleted as a chart frame. If chart settings are saved as a chart frame, the user can view a desired chart simply by loading a saved chart frame without having to configure new chart settings. This chart frame save function allows the user to utilize charts more efficiency by saving and loading different settings appropriate for various stock market situations and stocks.

Save: Click
Delete: List of saved chart frames can be viewed at the top of the ‘Chart Frame Save/Delete’ window. Select chart frames to be deleted from this list and click ‘Delete’ button.
Change name: To change name of an existing chart frame, select a chart frame to be renamed from the chart frame list at the top. Enter new save name into Save Name field and click ‘Change name’ button.
Edit Chart Tool
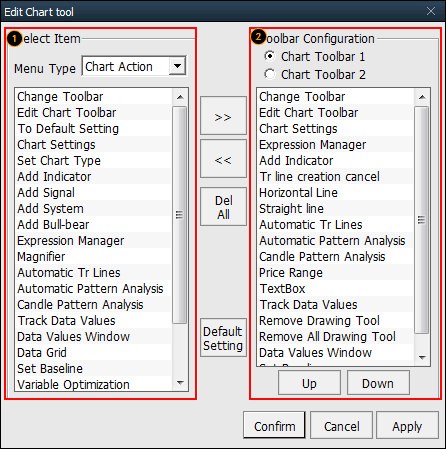
The chart toolbar is a toolbar that contains a group of tools used for chart analysis, located on the right side of the chart screen. Click at the top of the toolbar
to open the ‘Edit Chart Tool’ pop-up window.
The chart toolbar is a toolbar that contains a group of tools used for chart analysis, located on the right side of the chart screen. Click

Select items to be displayed on the chart toolbar. Items to be displayed on the chart tool bar
may include chart analysis tools and be selected by the user among ‘Chart Action, Analysis Tool and Chart Type.
Select Chart Action, Analysis Tool or Chart Type under ‘Menu Type’ to view detailed items in the area below.
Double click items to be added to the chart toolbar or click to select items and then click button.
List of items on the chart toolbar can be viewed. There can be two chart toolbars called ‘chart
toolbar 1 and chart toolbar 2’. Therefore, time of chart analysis can be shortened by differentiating between
chart toolbar 1 and chart toolbar 2.
To delete a specific item, click the item to select it and then click button. To delete the entire toolbar,
click
 button.
※ Order of chart toolbar Items of the toolbar can be adjusted from the toolbar list. Click to select an item to be moved and click buttons to move the item to desired position.
※ Order of chart toolbar Items of the toolbar can be adjusted from the toolbar list. Click to select an item to be moved and click
Add Indicator/Overlap/Change
This is a function to add, overlap or change an indicator. To use this function, put the mouse cursor on the chart, click the right mouse button and then select ‘Add/Overlap/Change Indicator’.
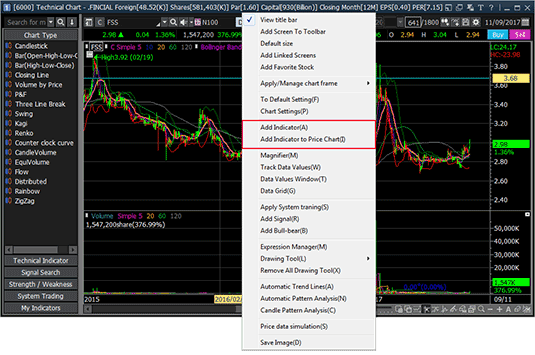
Add Indicator: This adds an indicator by creating a new area on the chart.
Overlap Indicator: This adds a new indicator in the existing indicator area to overlap two indicators in an area.
Change Indicator: This changes an existing indicator to a new indicator.
How to add/overlap indicator
Put the mouse cursor on the chart, click the right mouse button and select ‘Add/Overlap/Change Indicator’ to open the following ‘Add/Change’ pop-up window.

This is a function to add, overlap or change an indicator. To use this function, put the mouse cursor on the chart, click the right mouse button and then select ‘Add/Overlap/Change Indicator’.

Add Indicator: This adds an indicator by creating a new area on the chart.
Overlap Indicator: This adds a new indicator in the existing indicator area to overlap two indicators in an area.
Change Indicator: This changes an existing indicator to a new indicator.
How to add/overlap indicator
Put the mouse cursor on the chart, click the right mouse button and select ‘Add/Overlap/Change Indicator’ to open the following ‘Add/Change’ pop-up window.

Click an indicator to be added, overlapped or changed from the 'indicator list' or directly
enter name of the indicator into 'Search' field.
Click ‘Apply’ button.
The indicator is ‘added/overlapped/changed’ on the chart according to the function selected by
the user among ‘Add Indicator’, ‘Overlap Indicator’ and ‘Change Indicator’.
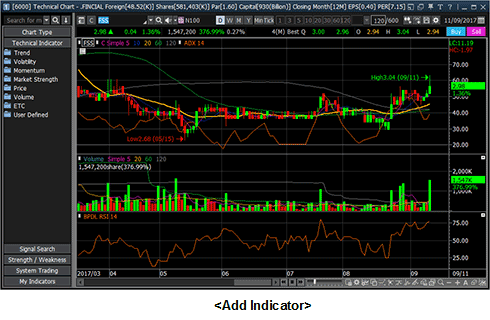
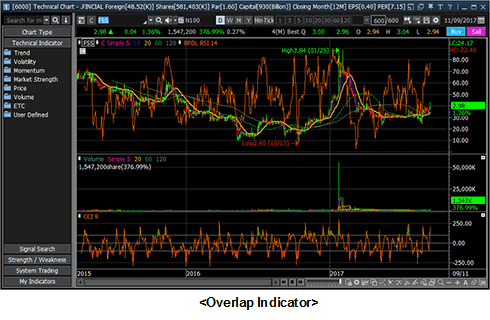
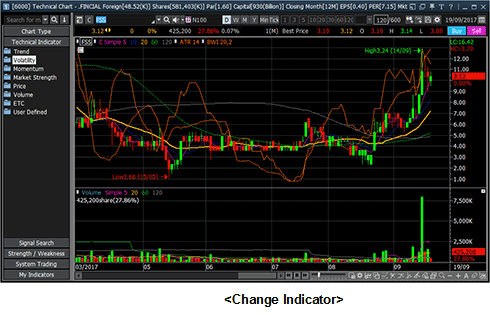
※ For 'Overlap Indicator', select an indicator to be overlapped and select an area to display value of the new indicator being overlapped on the existing indicator on the ‘Y Axis Show' window. Then click 'Confirm' button.
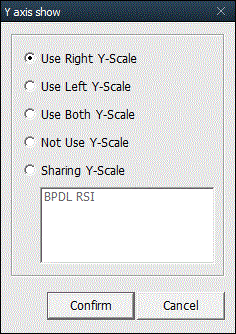


※ For 'Overlap Indicator', select an indicator to be overlapped and select an area to display value of the new indicator being overlapped on the existing indicator on the ‘Y Axis Show' window. Then click 'Confirm' button.

Chart Setting
(1) Chart property settings
Chart properties can be configured to efficiently arrange various functions and data on the chart. The user can find out price flow and important information through the chart in addition to chart analysis.
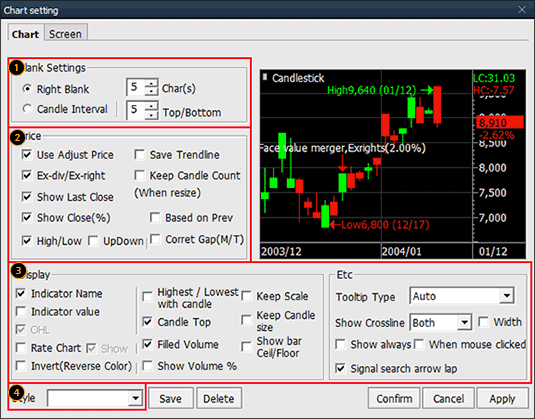
Chart screen settings can set background color, type and color of different lines, and font color and size of each area by largely dividing the chart into 'Chart Area', 'Scale Area' and Basic Font'. If chart background, line and font are configured efficiently on this screen, users who use computer for long time can greatly lessen stress of eyes and understand shapes of various indicators in greater details.
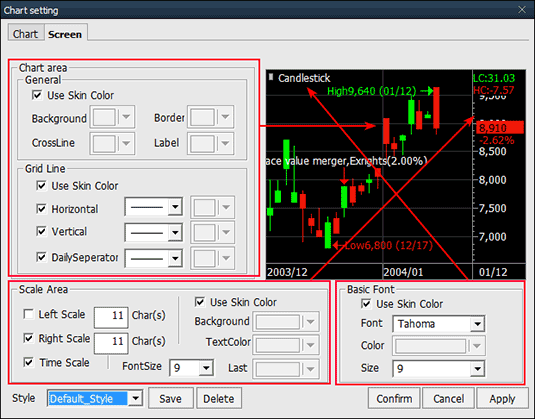
Click [▼] button of each item to set color, line style and font. Color settings
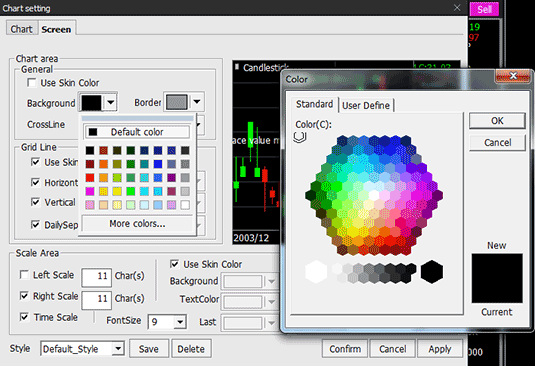
Chart properties can be configured to efficiently arrange various functions and data on the chart. The user can find out price flow and important information through the chart in addition to chart analysis.

Blank settings
Right blank margin of the chart can be set. Right blank of the chart can secure enough space to draw a trend line or enter a text for estimation of future price or show text.
Right blank margin of the chart can be set. Right blank of the chart can secure enough space to draw a trend line or enter a text for estimation of future price or show text.
Price
Use of adjust price, ex-div/ex-right, show last close, show percent change of close, and high/low can be selected. ※ Adjust price: Stock price of a company indicates change of capital. In other words, if there is a cause that affects capital of a company such as capital increase without consideration and capital reduction without refund, stock price is artificially adjusted by considering change in volume of capital. However, such artificial adjustment is not reflected on charts and various data, causing errors in stock price and various indicators during actual stock investment. Especially in charts, this greatly affects judgment of investors by influencing daily candle and various indicators. Adjust price is a price recalculated by accounting for factors of capital increase and capital decrease to prevent such distortion of stock price and indicate accurate price flow.
Use of adjust price, ex-div/ex-right, show last close, show percent change of close, and high/low can be selected. ※ Adjust price: Stock price of a company indicates change of capital. In other words, if there is a cause that affects capital of a company such as capital increase without consideration and capital reduction without refund, stock price is artificially adjusted by considering change in volume of capital. However, such artificial adjustment is not reflected on charts and various data, causing errors in stock price and various indicators during actual stock investment. Especially in charts, this greatly affects judgment of investors by influencing daily candle and various indicators. Adjust price is a price recalculated by accounting for factors of capital increase and capital decrease to prevent such distortion of stock price and indicate accurate price flow.
Display


Items to be displayed on charts such as ‘Indicator Name/Indicator Value/Rate Chart’ can be
selected.
Method of visual display on graphics and charts such as ‘Highest/Lowest with Candle/Candle
Top/Filled Volume' can be selected.
Options for efficient use of charts such as 'Tooltip Type/Always Show Cross Line/Show Cross
Line When Mouse Clicked’ can be set.
※ Indicator Value/Rate Chart
Select 'Indicator Value' to show various indicator values including moving average lines of stock price and volume on the chart. Select 'Rate Chart’ to show percent change (%) based on base price instead of stock price on the vertical axis (Y axis) of the chart.
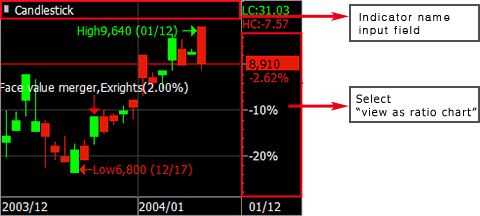
※ Indicator Value/Rate Chart
Select 'Indicator Value' to show various indicator values including moving average lines of stock price and volume on the chart. Select 'Rate Chart’ to show percent change (%) based on base price instead of stock price on the vertical axis (Y axis) of the chart.

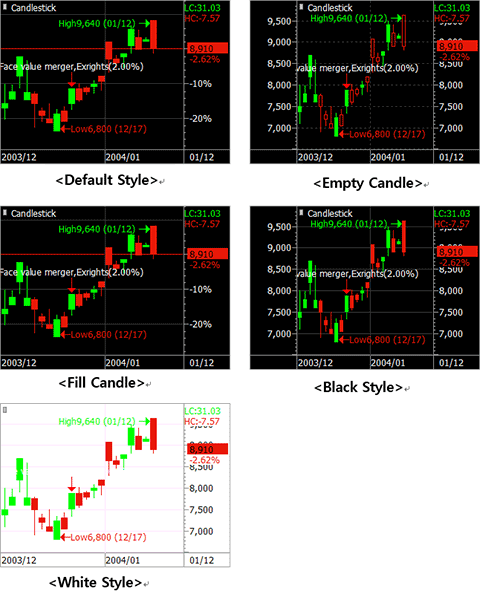
A style to be applied to the chart can be selected among 'Default Style/Empty Candle
Style/Fill Candle Style/Black Style/White Style’.
(2) Chart screen settings
Chart screen settings can set background color, type and color of different lines, and font color and size of each area by largely dividing the chart into 'Chart Area', 'Scale Area' and Basic Font'. If chart background, line and font are configured efficiently on this screen, users who use computer for long time can greatly lessen stress of eyes and understand shapes of various indicators in greater details.

Click [▼] button of each item to set color, line style and font. Color settings

Click [▼] button of each item to open a pop-up color table.
Double click the color to be used among basic colors. To use a different color, click ‘More
colors’ button.
Color can be selected under 'Standard' tab and 'User Define' tab. A color can be selected
from the standard color table of Korea under 'Standard' tab. In ‘User Define’ tab, the user can create a
color to be used.
Chart Settings
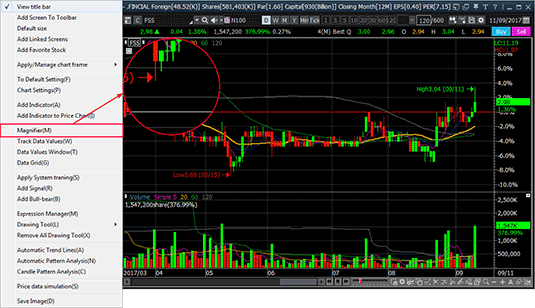
(1) Magnifier
Click the right mouse button and select magnifier function to magnify daily candle of stock price at the position of the mouse cursor. The magnifier function is not only a function for users with poor eyesight but has an ultimate purpose of further increasing success of trading through chart analysis by allowing more detailed observation of narrow price movement on the chart. In other words, trend line or support/resistance line can be drawn more accurately on the chart for detailed chart analysis. To cancel, click the right mouse button and uncheck the magnifier function.
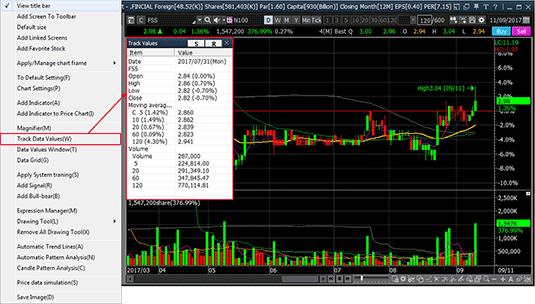
(2) Track Data Values
Click the right mouse button and select 'Track Data Values' to open a pop-up data window on the chart. This window views various indicator values of the chart including date and price at the position of the mouse cursor. To cancel, click the right mouse button and uncheck ‘Track Data Values’.
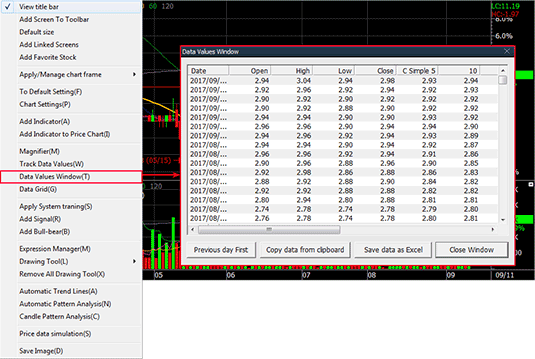
(3) Data Values Window
Click the right mouse button and select 'Data Values Window' to open the data values pop-up window on the chart. This window views daily price information (open/high/low/close and various indicators) of the stock. In addition, data can be copied onto Excel or clipboard to create a user database.
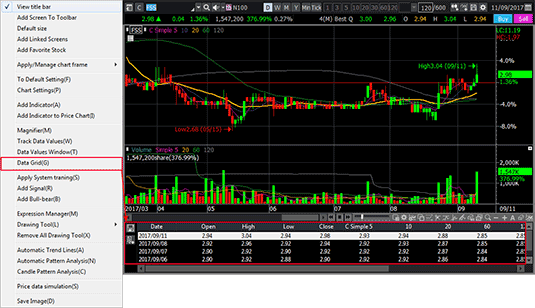
(4) Data Grid
Click the right mouse button and select 'Data Grid' to create a data grid at the bottom of the chart and view daily price information (open/high/low/close and various indicators). Difference from the data values window is that the data grid cannot copy data onto another program to make a database, whereas the data values window can. However, since the data grid can view daily price information while viewing the chart at the same time, it allows for more detailed chart analysis by correcting error and inaccuracy during analysis of trend line and support/resistance line.
Click the right mouse button and select magnifier function to magnify daily candle of stock price at the position of the mouse cursor. The magnifier function is not only a function for users with poor eyesight but has an ultimate purpose of further increasing success of trading through chart analysis by allowing more detailed observation of narrow price movement on the chart. In other words, trend line or support/resistance line can be drawn more accurately on the chart for detailed chart analysis. To cancel, click the right mouse button and uncheck the magnifier function.

(2) Track Data Values
Click the right mouse button and select 'Track Data Values' to open a pop-up data window on the chart. This window views various indicator values of the chart including date and price at the position of the mouse cursor. To cancel, click the right mouse button and uncheck ‘Track Data Values’.

(3) Data Values Window
Click the right mouse button and select 'Data Values Window' to open the data values pop-up window on the chart. This window views daily price information (open/high/low/close and various indicators) of the stock. In addition, data can be copied onto Excel or clipboard to create a user database.

(4) Data Grid
Click the right mouse button and select 'Data Grid' to create a data grid at the bottom of the chart and view daily price information (open/high/low/close and various indicators). Difference from the data values window is that the data grid cannot copy data onto another program to make a database, whereas the data values window can. However, since the data grid can view daily price information while viewing the chart at the same time, it allows for more detailed chart analysis by correcting error and inaccuracy during analysis of trend line and support/resistance line.

Drag & Drop
Drag & Drop function of HERO FSS is used in two parts, 'Chart Zoom' and 'Overlap Indicator’.
Drag & Drop function of HERO FSS is used in two parts, 'Chart Zoom' and 'Overlap Indicator’.
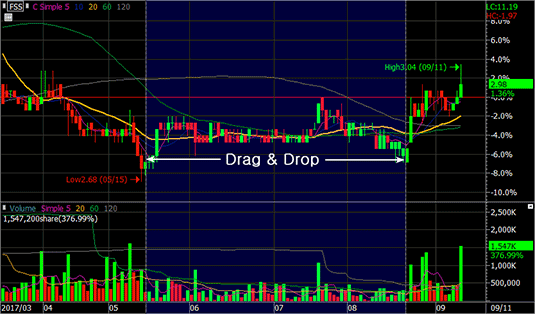
(1) Chart Zoom
Click the mouse button from the starting point to the ending point of the section to be zoomed in on the chart. Drag from left to right and drop to zoom into the selected part. The screen can be zoomed out to view the entire chart by dragging and dropping from right to left. Double click the chart to return to the immediately previous screen size.
(2) Overlap Indicator
Click the mouse button from the starting point to the ending point of the section to be zoomed in on the chart. Drag from left to right and drop to zoom into the selected part. The screen can be zoomed out to view the entire chart by dragging and dropping from right to left. Double click the chart to return to the immediately previous screen size.

(2) Overlap Indicator
Set two or more indicators on the chart.
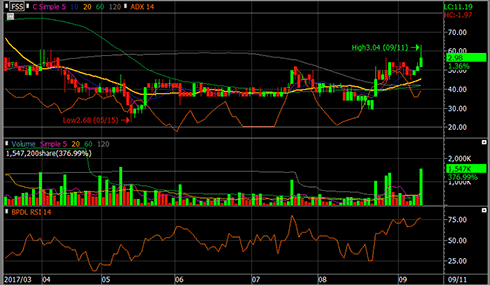

Click the left mouse button on the indicator to be overlapped and drag & drop it onto another
indicator.
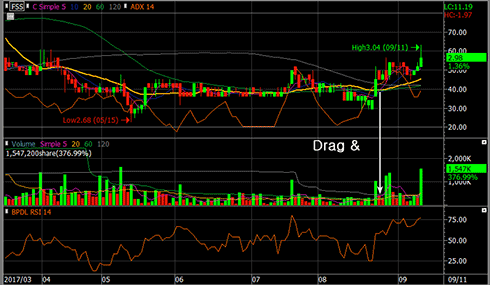

Select a method of showing two indicators in a single indicator area on the 'Y Axis Show’ window
and click ‘Confirm’ button.
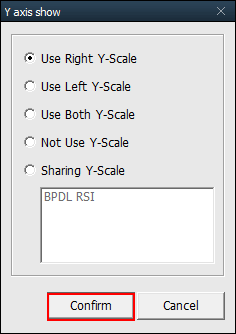

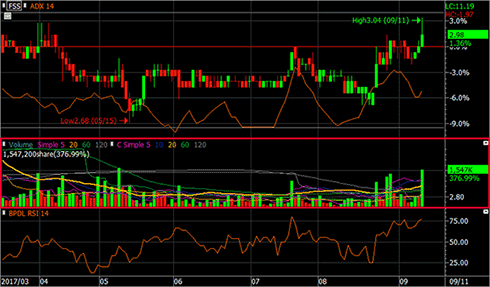
Two indicators are shown in one area.

Automatic Trend Line
The automatic trend line function is a function that automatically draws a trend line by analyzing the trend during a period selected by the user among ‘short-term/mid-term/long-term’ trend lines. This removes error and inaccuracy of trend line drawn by investors on their own, allowing the user to easily draw trend lines in the most objective and scientific way.
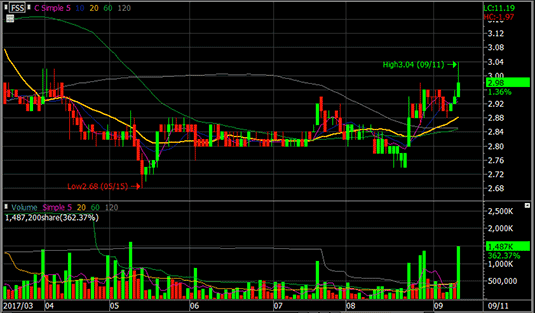
The automatic trend line function is a function that automatically draws a trend line by analyzing the trend during a period selected by the user among ‘short-term/mid-term/long-term’ trend lines. This removes error and inaccuracy of trend line drawn by investors on their own, allowing the user to easily draw trend lines in the most objective and scientific way.

To run automatic trend line, click  button on the chart toolbar on the right side of the screen or click the right mouse button on the chart and
select ‘Automatic Trend Lines’
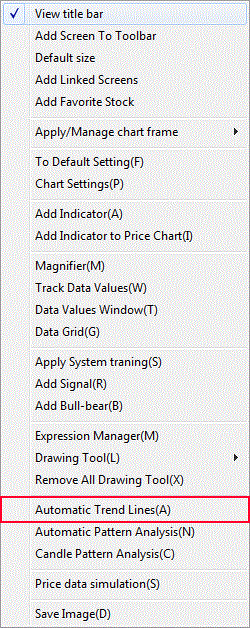

The ‘Set Auto Trend Line’ window will pop up. Select the term of the trend line, number of candles and color of
the automatic trend line. After selecting, click 'Confirm' button.
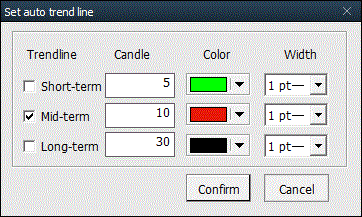
Type of trend line: Check the trend line to be applied. Two or more types can be selected.
Color: Click [▼] button to select a color for each trend line.
Click button on the chart toolbar once again or click
the right mouse button on the chart and uncheck ‘Automatic Trend Lines’ to remove the trend line drawn

Type of trend line: Check the trend line to be applied. Two or more types can be selected.
Color: Click [▼] button to select a color for each trend line.
Click
The chart drawn with the automatic trend line for the set period can be viewed.
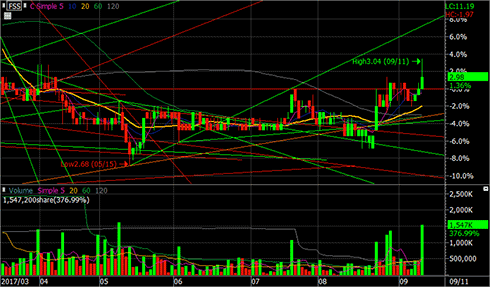
Type of trend line: Check the trend line to be applied. Two or more types can be selected. Color: Click [▼] button to select a color for each trend line
Click button on the chart toolbar once again or click
the right mouse button on the chart and uncheck ‘Automatic Trend Lines’ to remove the trend line drawn.
Color: Click [▼] button to select a color for each trend line.

Type of trend line: Check the trend line to be applied. Two or more types can be selected. Color: Click [▼] button to select a color for each trend line
Click
Color: Click [▼] button to select a color for each trend line.
Automatic Pattern Analysis
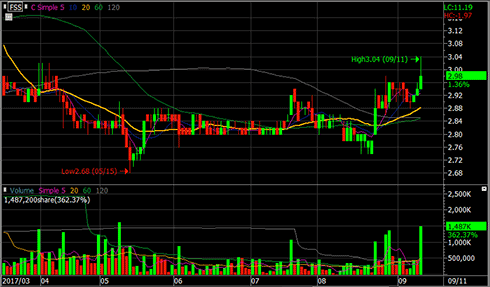
Technical analysis has significance among different analysis methods because of the assumption that stock prices repeat flow shown in the past. Among technical analysis methods, the pattern analysis method is one of the most effective methods of explaining movement of stock price. Automatic pattern analysis is a function that automatically analyzes stock price pattern among various methods of analyzing previous flow of stock price.
Technical analysis has significance among different analysis methods because of the assumption that stock prices repeat flow shown in the past. Among technical analysis methods, the pattern analysis method is one of the most effective methods of explaining movement of stock price. Automatic pattern analysis is a function that automatically analyzes stock price pattern among various methods of analyzing previous flow of stock price.
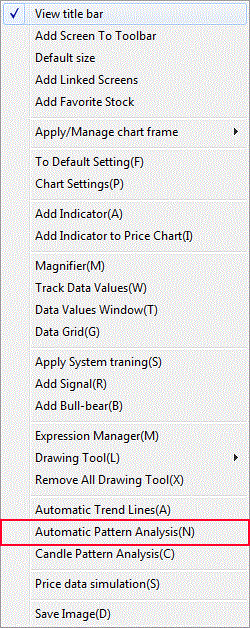
To run automatic pattern analysis, click  button on
the right side of the screen or click the right mouse button on the chart and select ‘Automatic Pattern
Analysis’.

Pattern of previous price flow is analyzed automatically as shown in the figure.

Candle Pattern Analysis
Candle pattern analysis is one of the most basic parts to be learned during early stage of stock investment. In reality, many investors start learning technical analysis with candle pattern analysis. However, as investors learn about candle analysis, they become doubtful about its efficiency compared to time required for learning because there are numerous candle patterns according to positions of rise, fall, unchanged, ceiling and floor and number of candle combinations.
Candle pattern analysis is one of the most basic parts to be learned during early stage of stock investment. In reality, many investors start learning technical analysis with candle pattern analysis. However, as investors learn about candle analysis, they become doubtful about its efficiency compared to time required for learning because there are numerous candle patterns according to positions of rise, fall, unchanged, ceiling and floor and number of candle combinations.
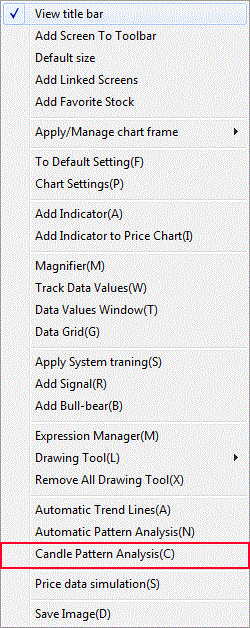
To run candle pattern analysis, click  on the chart
toolbar on the right side of the screen or click the right mouse button on the chart.

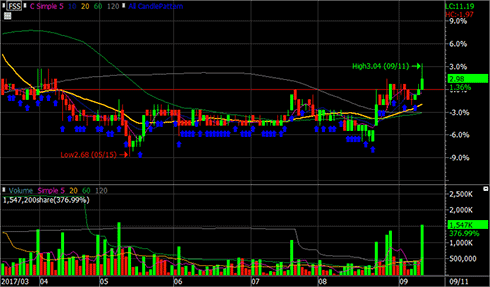
Candle patterns are displayed on the chart.
Double click an arrow next to a candle to find out candle pattern analysis.
 The following ‘Candle Pattern’ window pops up to show typical shape of the selected pattern on the left side and
name and interpretation of the pattern on the right side.
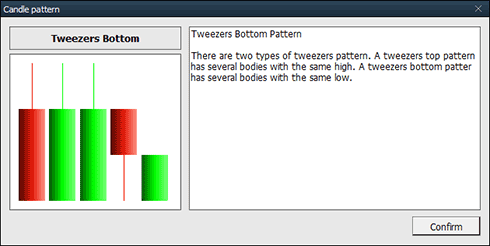
Double click an arrow next to a candle to find out candle pattern analysis.
 The following ‘Candle Pattern’ window pops up to show typical shape of the selected pattern on the left side and
name and interpretation of the pattern on the right side.
Change/Add Stock
Charts on HERO FSS show ‘Change Stock' mode. The change stock mode changes the chart into the chart of a new stock by entering a stock code.
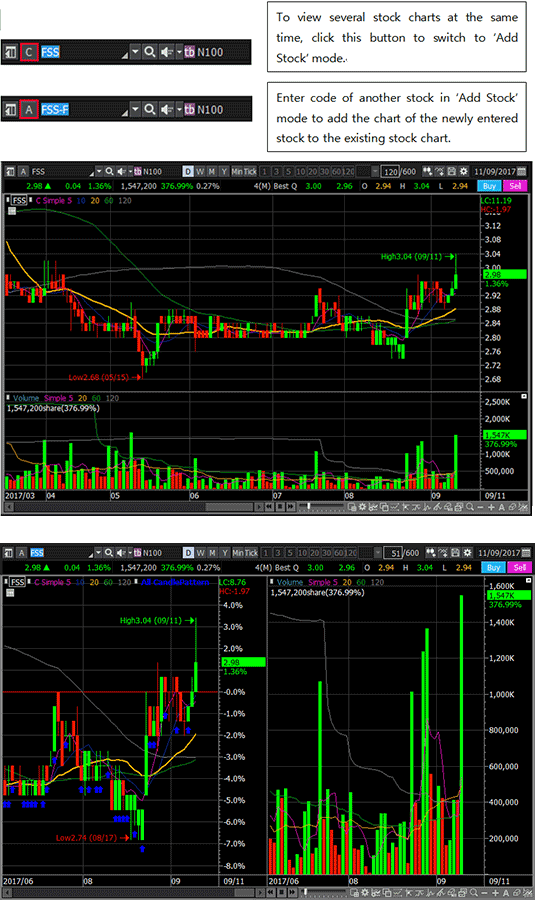
※ Click on the bottom menu of the chart to change the chart into vertical shape
Charts on HERO FSS show ‘Change Stock' mode. The change stock mode changes the chart into the chart of a new stock by entering a stock code.

※ Click
Price change is a function that displays the number of candles or days and change of price on the chart when the
user clicks the mouse button and moves the cursor from a point to another point on the chart.
This function is convenient when verifying or checking a theory related to time or period among technical analyses using a chart. It is especially useful when interpreting Ichimoku cloud.
This function is convenient when verifying or checking a theory related to time or period among technical analyses using a chart. It is especially useful when interpreting Ichimoku cloud.
System Trading
To use system trading, “Chart Type”, “Technical Indicator”, “Signal Search”, “Strength/Weakness” and “System
Trading” menus must be used on the left side of the chart.
Especially, “System Trading” menu can be used for system trading. Other menus are used to show various
indicators and signals that can be used as reference trading information by the user.
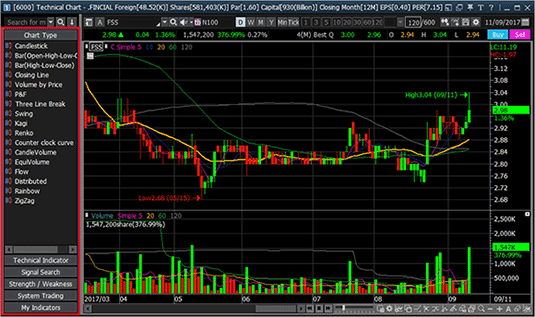

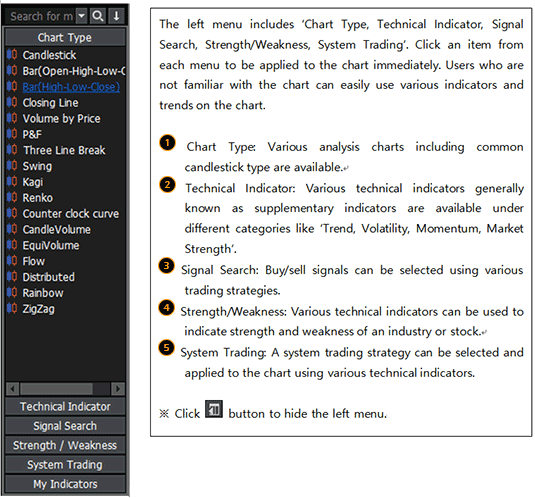
Chart Type
Apply Chart
Click a chart type item selected or drag & drop an item into the chart to change existing chart to the selected chart type.
Click a chart type item selected or drag & drop an item into the chart to change existing chart to the selected chart type.
Chart Type
 Candle Chart
Candle chart is a so-called Japanese chart that is comprised of open, high, low and close. Body of a candle is comprised of open and close, and tail of a candle is comprised of high and low. Body color of a candle generally uses red when daily close is higher than open and blue when daily close is lower than open.
 Bar Chart
Bar chart is a so-called American chart that is only comprised of open, high, low and close. Maximum and minimum of a bar indicate high and low of the bar. Open is expressed by the left branch of the bar and close is expressed by the right branch of the bar. As a default setting, the bar uses red color when price increases and blue color when price decreases.
 Closing Line Chart
Closing line chart is a linear chart simply made by connecting close prices, and it also called a line chart. The user can change color of the chart.
 Volume by Price Chart
This is a bar type chart that shows volume by price, used to analyze area. Area analysis chart has a variable called [Volume by Price] unlike other price charts mentioned above. This is a variable that creates volume of area by dividing price by value of the variable.
 P&F Chart
P&F chart is a chart that slightly breaks away from the concept of time. This chart is used to analyze trend focusing on rise and fall of price. X is marked in red when price rises above base price, and O is marked in blue when it falls below base price. The concept of time is excluded here. It moves by one slot, only when changing between X and O. Variables of P&F chart are [slot change] and [slot size], and they allow the user to create customized P&F.
 Three Line Break
Three line beak has a similar concept as P&F. When price changes by more than the slot change variable, the chart is changed to blue or red. It is expressed in red when price increases and blue when price decreases. Variable is changed to slot change variable. Swing Chart
 Kagi Chart
 Renko Chart
 Counter Clock Curve
Counter clock curve is a price chart that shows the correlation between price and volume. Volume is shown on the X axis and stock price on the Y axis. Price and volume are averaged based on the number of days that correspond to the variable (moving average) and displayed on the chart. It is called the counter clock curve because it rotates counterclockwise. Variable can be changed to moving average line value. A 20-day average line or 25-day average line is used in general.
 Candle Volume Chart
 Equi Volume Chart
Equi volume chart is a concept that combines candle and volume. This chart shows horizontal width of a candle as the ratio of volume of the candle to total volume. Therefore, width of a candle increase as its volume increases. Chart settings include color for price rise/fall similar to the candle chart and area filling. Flow Chart
 Distributed Chart
 Rainbow Chart
 Zigzag Chart
Candle chart is a so-called Japanese chart that is comprised of open, high, low and close. Body of a candle is comprised of open and close, and tail of a candle is comprised of high and low. Body color of a candle generally uses red when daily close is higher than open and blue when daily close is lower than open.
Bar chart is a so-called American chart that is only comprised of open, high, low and close. Maximum and minimum of a bar indicate high and low of the bar. Open is expressed by the left branch of the bar and close is expressed by the right branch of the bar. As a default setting, the bar uses red color when price increases and blue color when price decreases.
Closing line chart is a linear chart simply made by connecting close prices, and it also called a line chart. The user can change color of the chart.
This is a bar type chart that shows volume by price, used to analyze area. Area analysis chart has a variable called [Volume by Price] unlike other price charts mentioned above. This is a variable that creates volume of area by dividing price by value of the variable.
P&F chart is a chart that slightly breaks away from the concept of time. This chart is used to analyze trend focusing on rise and fall of price. X is marked in red when price rises above base price, and O is marked in blue when it falls below base price. The concept of time is excluded here. It moves by one slot, only when changing between X and O. Variables of P&F chart are [slot change] and [slot size], and they allow the user to create customized P&F.
Three line beak has a similar concept as P&F. When price changes by more than the slot change variable, the chart is changed to blue or red. It is expressed in red when price increases and blue when price decreases. Variable is changed to slot change variable.
Counter clock curve is a price chart that shows the correlation between price and volume. Volume is shown on the X axis and stock price on the Y axis. Price and volume are averaged based on the number of days that correspond to the variable (moving average) and displayed on the chart. It is called the counter clock curve because it rotates counterclockwise. Variable can be changed to moving average line value. A 20-day average line or 25-day average line is used in general.
Equi volume chart is a concept that combines candle and volume. This chart shows horizontal width of a candle as the ratio of volume of the candle to total volume. Therefore, width of a candle increase as its volume increases. Chart settings include color for price rise/fall similar to the candle chart and area filling.
Price Chart Settings
Double click the price chart to open the chart type setting pop-up window.
Double click the price chart to open the chart type setting pop-up window.
Type
Color, style and variable of each price chart type can be set.
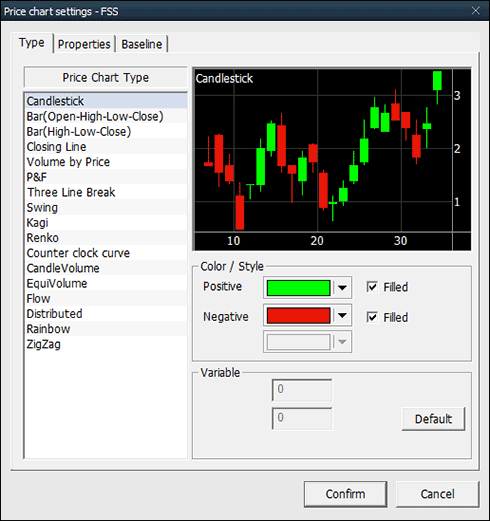
Color, style and variable of each price chart type can be set.

Properties
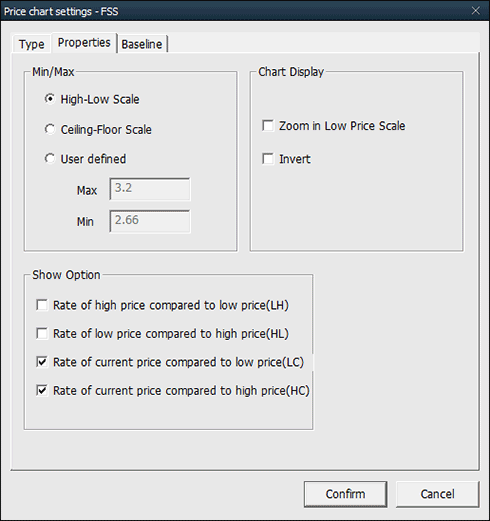
 Min/Max: Min/max
scale of the Y axis (price) can be set. Min/max are configured based on date shown on a screen. Overall setting
is done based on all data viewed, and user defined setting configures min/max of the Y axis according to values
entered by the user.
 Show Option: Rate
of high price compared to low price, rate of current price compared to low price and rate of current price
compared to high price are displayed in the Y axis area on the left side of the price chart.
 Change Y Axis:
Log or invert can be applied to the Y axis of the price chart.

Baseline
Prices of today and previous day shown on the chart, pivot, demark and use defined colors can be selected.
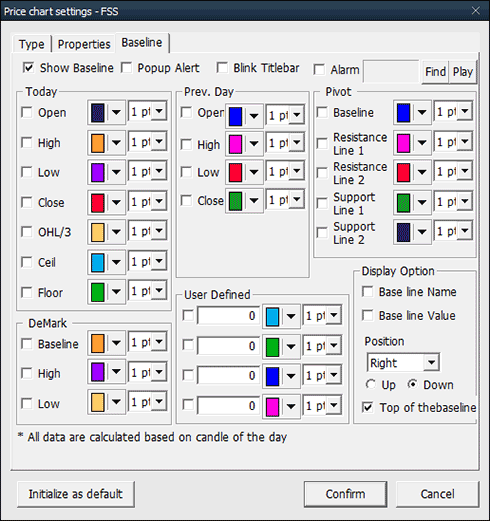
Prices of today and previous day shown on the chart, pivot, demark and use defined colors can be selected.

System Trading
Indicator Application
Click
Select an indicator from the list of technical indicators and click to add the indicator at the bottom of the chart.
Select an indicator from the list of technical indicators and click to add the indicator at the bottom of the chart.
Drag & Drop
Drag an indicator from the list of technical indicators and drop it to a position on the chart. The selected indicator will be added at the dropped position. To overlap the indicator onto an existing indicator, drop the mouse cursor on the existing indicator. Here, the Y axis show window appears as pop-up. This window configures the relationship between the existing indicator and Y axis. Select Y axis relationship to show the existing indicator and selected indicator in the same area.
Drag an indicator from the list of technical indicators and drop it to a position on the chart. The selected indicator will be added at the dropped position. To overlap the indicator onto an existing indicator, drop the mouse cursor on the existing indicator. Here, the Y axis show window appears as pop-up. This window configures the relationship between the existing indicator and Y axis. Select Y axis relationship to show the existing indicator and selected indicator in the same area.
Indicator Composition
Click
Indicators include basic indicators (6 categories) and user indicators.
Indicators include basic indicators (6 categories) and user indicators.
User indicators created and saved by the user through Formula Manager (refer to analysis toolbar
on the left side of the chart area) appear as a list.
Indicator
Click an indicator on the chart to open the indicator setting pop-up window.
Click an indicator on the chart to open the indicator setting pop-up window.
Indicator setting
Indicator variables can be changed under description tab. To use the variables permanently, check “Save as default” item at the bottom and click Confirm button.
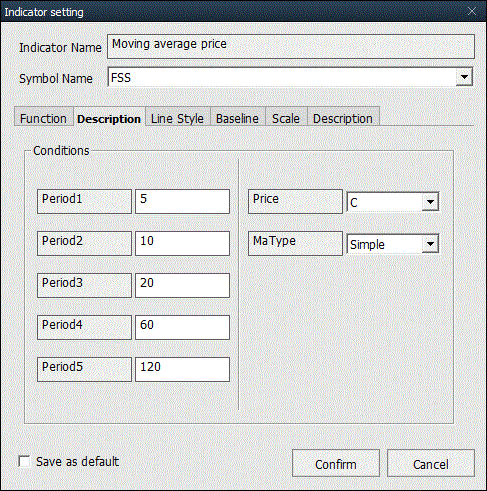
Indicator variables can be changed under description tab. To use the variables permanently, check “Save as default” item at the bottom and click Confirm button.

Line style tab
Number of lines created is equal to number of functions. Color, type, style and thickness can be configured for each line. If line type is line, overheat and recession can be set. If line type is bar, rise and fall can be set for comparison (baseline, previous close, current price, etc.).
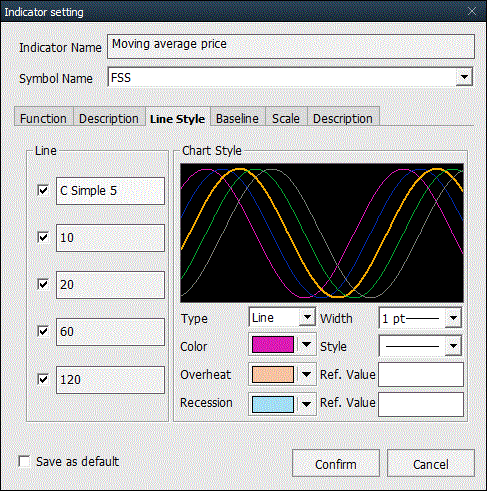
Number of lines created is equal to number of functions. Color, type, style and thickness can be configured for each line. If line type is line, overheat and recession can be set. If line type is bar, rise and fall can be set for comparison (baseline, previous close, current price, etc.).

Function tab
Indicator functions can be viewed. Up to 5 functions are supported.
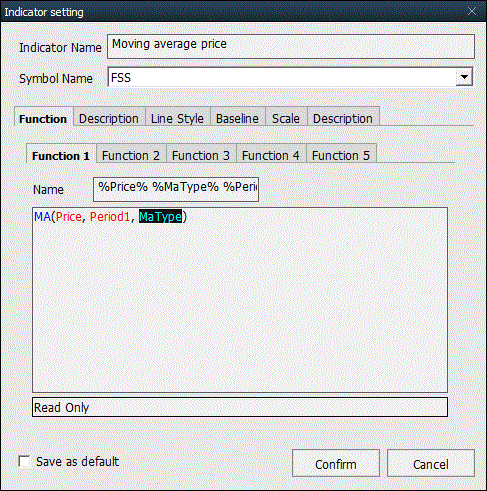
Indicator functions can be viewed. Up to 5 functions are supported.

Baseline tab
The user can add, delete and change setting of baseline.
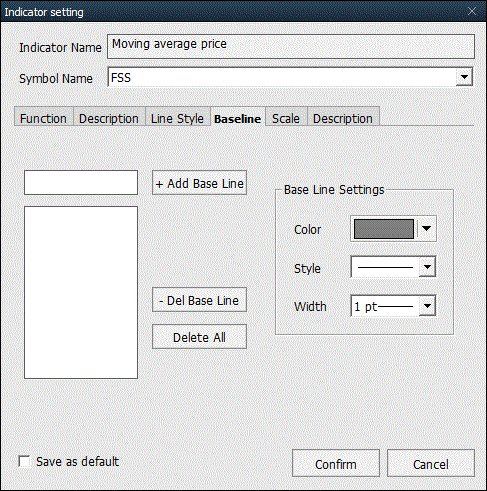
The user can add, delete and change setting of baseline.

Description tab
Description of the indicator is provided.
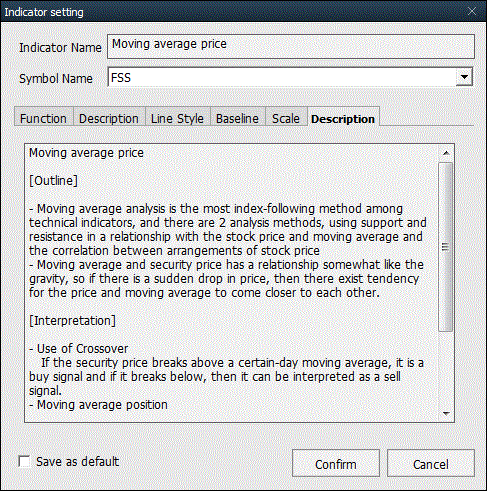
Description of the indicator is provided.

Signal Search
Signal Search Application
Click or Drag & Drop
After selecting an item from the list of search conditions, click the mouse button to display the condition search signal in the price chart area.
After selecting an item from the list of search conditions, click the mouse button to display the condition search signal in the price chart area.
Set Signal Search
Function tab
Signal search functions can be checked to configure color and display settings of signal.
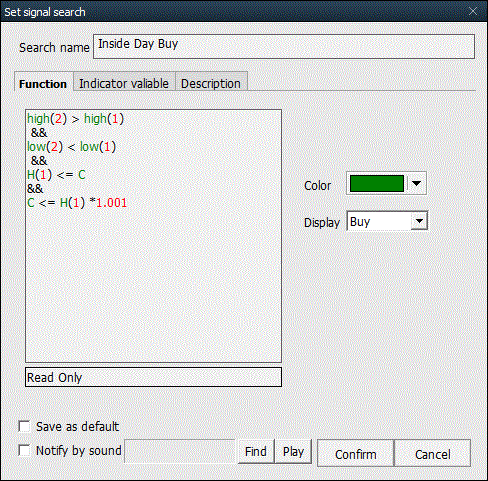
Signal search functions can be checked to configure color and display settings of signal.

Indicator variable tab
Variables of signal search can be set.
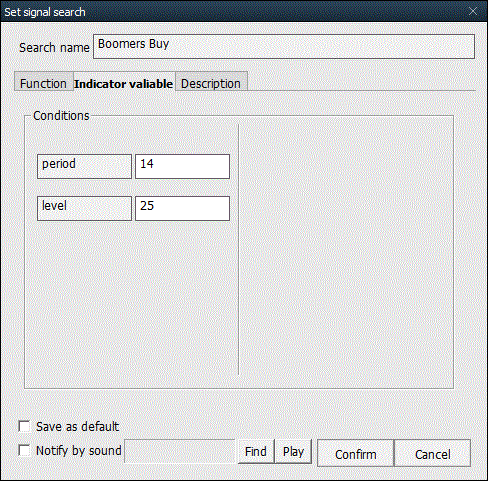
Variables of signal search can be set.

Description tab
Description is provided.
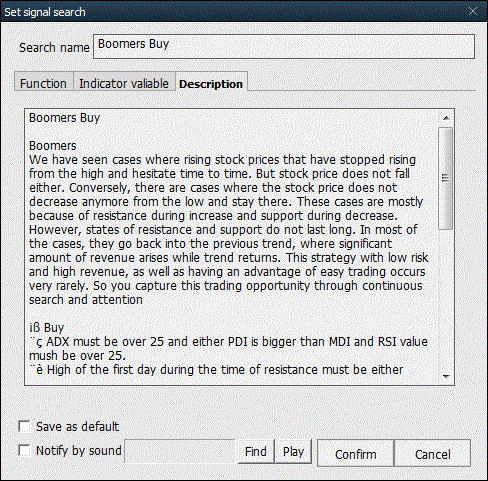
Description is provided.

Strength/Weakness
Strength/Weakness Application
Click or Drag & Drop
Select an item from the strength/weakness list and click the mouse button to display strength/weakness signal.
Select an item from the strength/weakness list and click the mouse button to display strength/weakness signal.
Bullish/Bearish Setting
Function tab
Functions for bullish and bearish patterns can be checked.
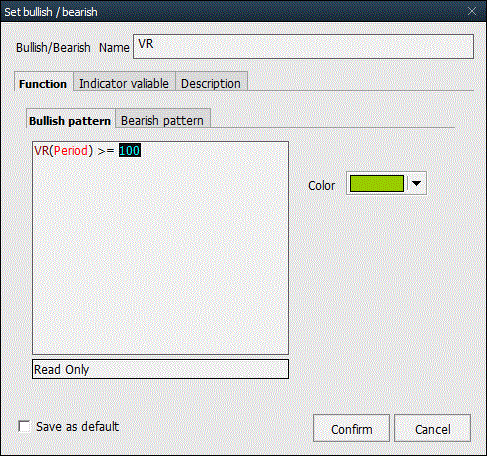
Functions for bullish and bearish patterns can be checked.

Indicator variable tab
Variables can be changed.
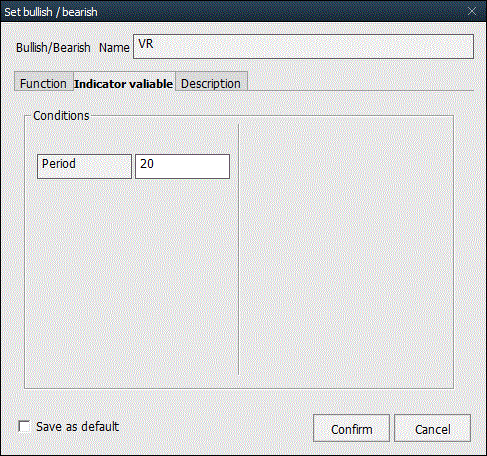
Variables can be changed.

Description tab
Description is provided.
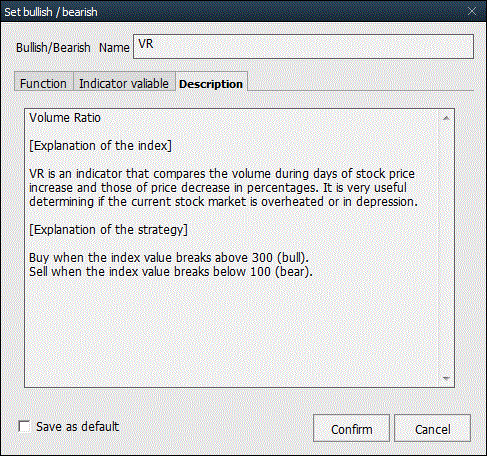
Description is provided.

System Trading
System Trading Application
Click or Drag & Drop
Select an item from the trading strategy list and click the mouse button to display trade strategy signal.
Select an item from the trading strategy list and click the mouse button to display trade strategy signal.
System Trading Setting
Trade strategy condition setting
When trade strategy is applied, the trade strategy condition setting window pops up. Position, order and stop loss settings can be configured.
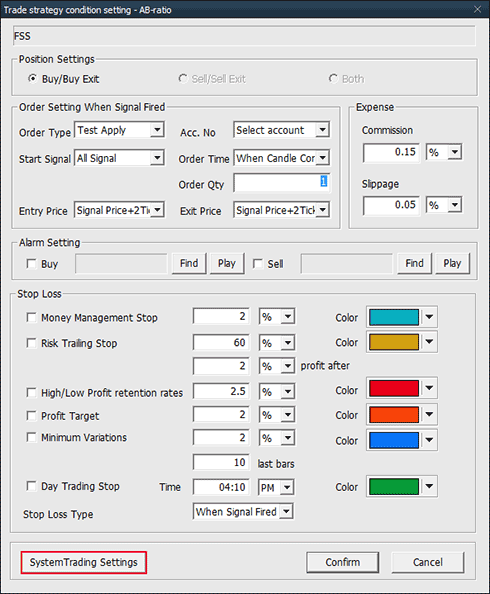
When trade strategy is applied, the trade strategy condition setting window pops up. Position, order and stop loss settings can be configured.

Trade strategy function tab
Functions of trade strategy can be checked.
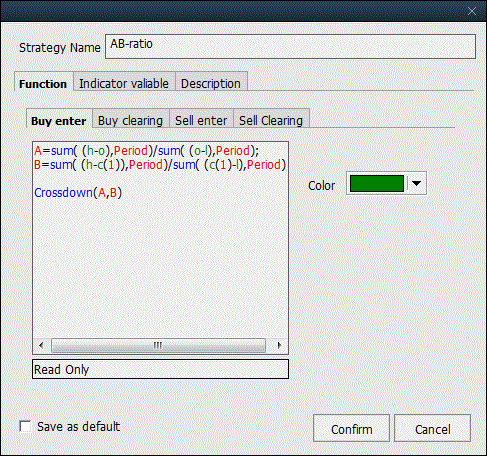
Functions of trade strategy can be checked.

Indicator variable tab
Trade strategy variables can be changed.
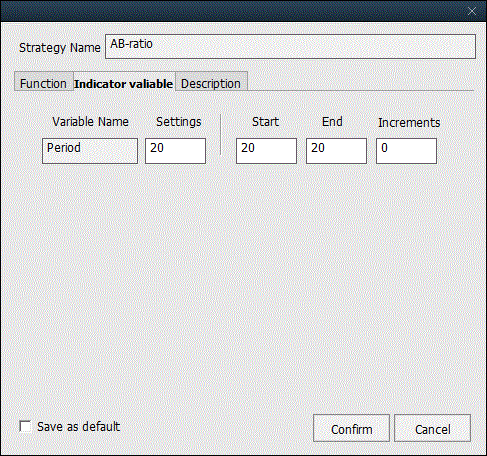
Trade strategy variables can be changed.

Trade strategy description tab
Description of trade strategy is provided.
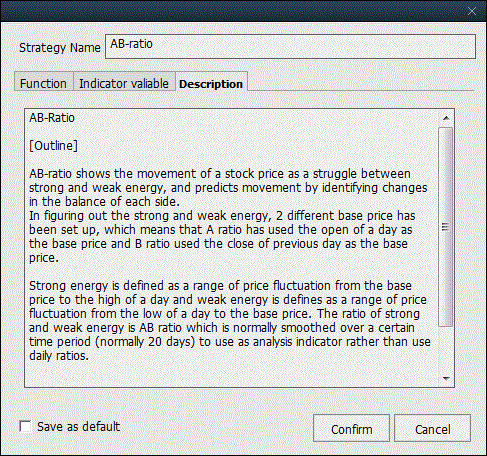
Description of trade strategy is provided.

