[1103] Top Net Bid Offer Volume PDF
1. Overview of Screen
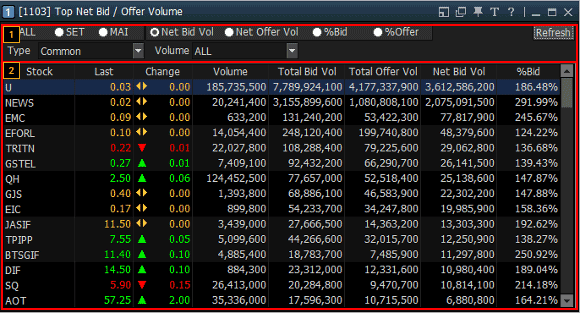
This is a screen to view information about stocks with top bid/offer volumes in ‘SET, MAI’ markets.
Stocks with top bid/offer volume can be viewed according to order of ‘Net Bid Volume, Net Offer Volume, %Bid,
%Offer’. Be aware that data are based on the time of view and do not reflect changes in real time.


2. Description of Screen
Selection Area


Type Common and Volume All boxes can be checked to designate detailed conditions of view.

Tip. Pros and cons of remaining bid/offer volume analysis
Remaining bid/offer volume analysis is a type of bid/offer analysis method. Especially, buy/sell ratio is used often. Buy/sell ratio represents total remaining volume of 5-step bid/offer shown as a percentage, indicating size of buy/sell strength.
Such ratio analysis method has an advantage of measuring and showing buy/sell strength as an objective value, but there is a problem of not being able to follow up on price changes caused by market movement or external variables influencing each stock.
Display Area
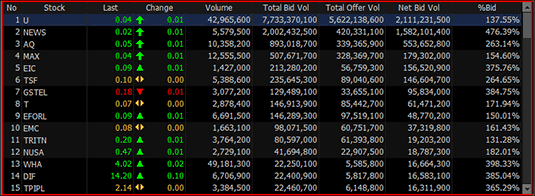
List of stocks with top net bid/offer volume that satisfy the given conditions and price information can be viewed.
List of stocks with top net bid/offer volume that satisfy the given conditions and price information can be viewed.

| Column | Description |
| No | Number of stocks. |
| Stock | Name of stocks. |
| Last | Last price of traded. |
| Change | Price changed compared with previous day. |
| Total Bid Vol | Total bid volume in that moment. |
| Total Offer Vol | Total offer volume in that moment. |
| Net Bid Vol | Net bid volume (Total Bid Vol - Total Offer Vol). |
| Net Offer Vol | Net offer volume (Total Offer Vol - Total Bid Vol). |
| %Bid | Total bid volume compared with Total offer volume by percentage. (Total Bid Vol / Total Offer Vol) x 100 |
| %Offer | Total offer volume compared with Total offer volume by percentage. (Total Offer Vol / Total Bid Vol) x 100 |
